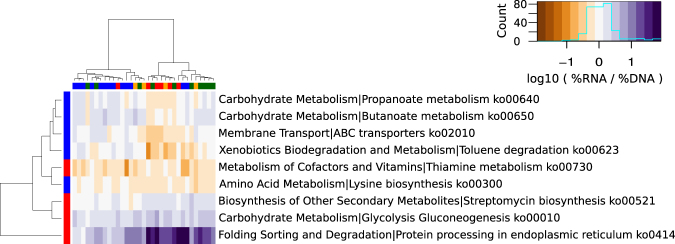
Fig. 4.
Heatmap of relative gene expression of pathway biomarkers. Hierarchical clustering representation of gene expression ratio (|log10 RNA/DNA| > 0). Only pathways that were significantly over- or underexpressed (BH-adjusted P value ≤0.05) and were significantly differentially expressed between HIV+ and HIV− subjects (Wilcoxon test, BH-adjusted P value ≤0.05) were included in the analysis. Overrepresented pathways in HIV+ subjects are in red, blue indicates overrepresented pathways in uninfected individuals. VU viremic untreated subjects (red); IR immunological responders (green); INR immunological non-responders (orange) and HIV− subjects (blue) were represented as tips of the column’s cladogram. The brown to purple gradient represents relative gene expression level

