Figure 3.

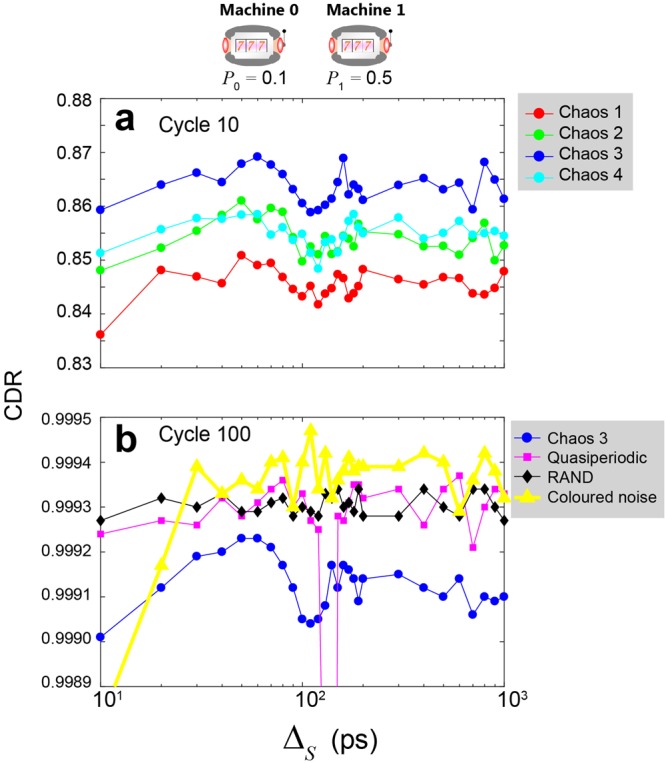
Decision-making performance as a function of inter-decision sampling interval. CDR comparison at cycles (a) 10 and (b) 100. In this analysis, the reward probabilities of Machine 0 and 1 are 0.1 and 0.5, respectively.

Decision-making performance as a function of inter-decision sampling interval. CDR comparison at cycles (a) 10 and (b) 100. In this analysis, the reward probabilities of Machine 0 and 1 are 0.1 and 0.5, respectively.