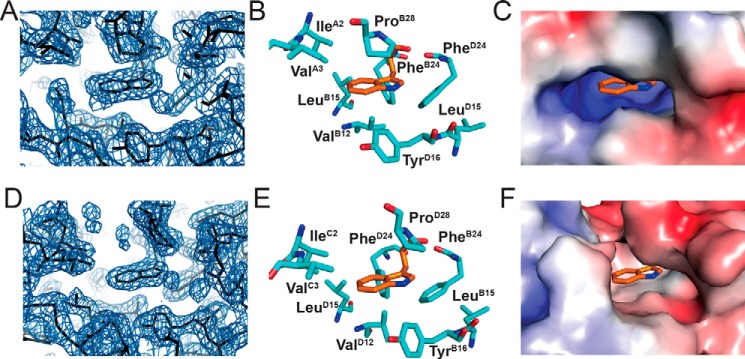
Figure 6.
Crystal structure of [TrpB26,OrnB29]insulin. A, electron density of TrpB26 in T-state protomer showing the surrounding density in TRf asymmetric unit (contour level 2.0 Å). B, stick model corresponding to map in A; TrpB26 is orange. C, surfaces of residues surrounding TrpB26 (sticks) as indicated above. D–F, corresponding map and models of TrpB26 in the R state protomer.

