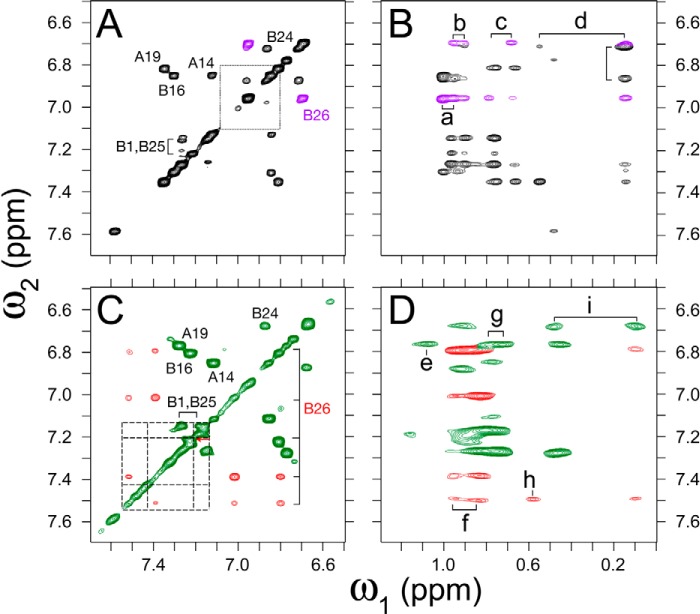
Figure 8.
Homonuclear 2D NMR of a TrpB26 analog. 2D NMR studies of insulin analogs indicate similar TyrB26- and TrpB26 environments. A and B, spectra of parent monomer insulin lispro ([LysB28,ProB29]insulin): A, aromatic region of TOCSY spectrum with TyrB26 cross-peaks (magenta) shown relative to the Tyr spin system in free octapeptide GFFYTKPT (dotted lines); and B, region of NOESY spectrum showing contacts between aromatic protons (vertical axis, ω2) and methyl groups (horizontal axis, ω1). C and D, spectra of TrpB26 analog of insulin lispro: C, aromatic TOCSY spectrum highlighting TrpB26 cross-peaks (red) relative to the Trp spin system in free octapeptide GFFWTKPT (dashed lines) and D, region of NOESY spectrum corresponding to B. B26-related NOEs are shown in red. Cross-peak assignments: (a) γ-CH3 ValA3, (b) γ-CH3 ValB12, (c) γ-CH2, γ-CH3 IleA2, (d) δ-CH3 LeuB15, (e) γ-CH3 ValA3, (f) γ-CH3 ValB12, (g) γ-CH2, γ-CH3 IleA2, (h) δ-CH3 IleA2, and (i) δ-CH3 LeuB15. TOCSY mixing times in spectra A and C were 55 ms; NOESY mixing times in B and D were 150 ms.

