Figure 9.
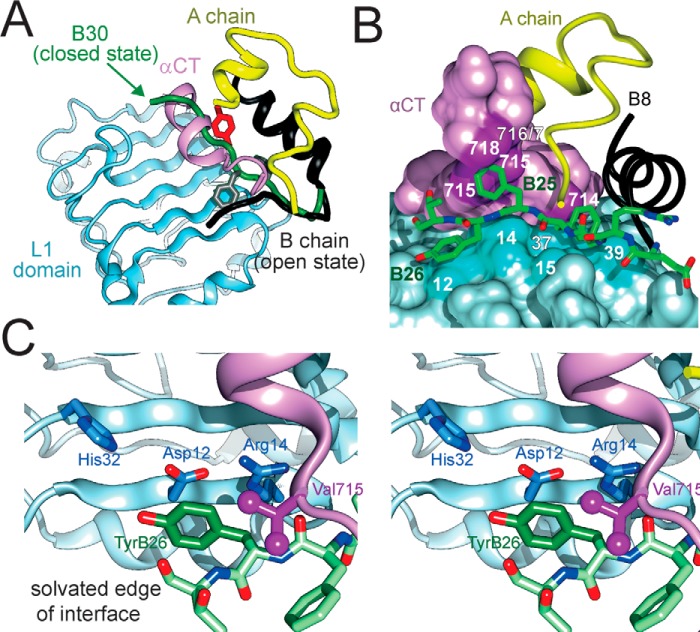
Binding surface of TyrB26 on an IR fragment. A, model of WT insulin (in classical T-state) overlaid on the structure of insulin bound to an IR fragment (PDB entry 4OGA). The L1 domain and part of the CR domain are shown in powder blue, whereas αCT is shown in purple. PheB24 and TyrB26 are, respectively, shown as gray and red sticks. The B-chain of IR-bound insulin is shown in dark gray (B6–B19) or black (B20–B27); the green tube indicates a classical location within overlay of residues B20–B30 (green arrow), thereby highlighting the steric clash of B26–B30 with αCT. Insertion of the insulin B20–B27 segment between L1 and αCT was associated with a small rotation of the B20–B23 β-turn and changes in main chain dihedral angles flanking B24. B, stick representation of B-chain residues B20–B27 packed between αCT and the L1 β2 strand. Color code in insulin segment: carbon atoms (green), nitrogen (blue), and oxygen (red). Residues B8–B19 are shown as a black ribbon, and the A-chain is shown as a yellow ribbon. Key contact surfaces of αCT with B24–B26 are highlighted in magenta and L1 with B24–B26 are highlighted in cyan. C, stereo view of the environment of TyrB26 within its binding site. Neighboring side chains in L1 and αCT are as labeled. This figure was adapted from Ref. 18 with permission of the authors.

