
Figure 3.
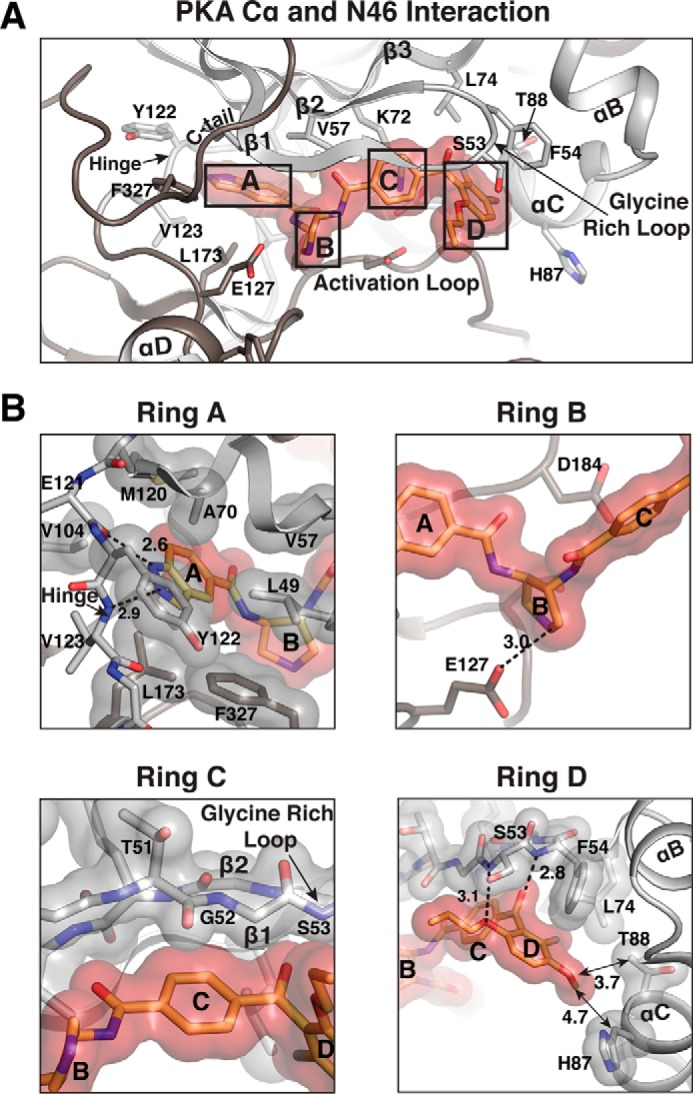
Interactions between PKA Cα and N46. A, detailed interactions with N46. Only the regions near the active site are shown. Residues contacting N46 are shown as sticks. B, enlarged views for each ring of N46, highlighting its interactions with different regions of the active site. Residues that provide VDW interactions are shown with transparent surfaces. Hydrogen bonds are shown as dotted lines, with their distances given in angstroms.