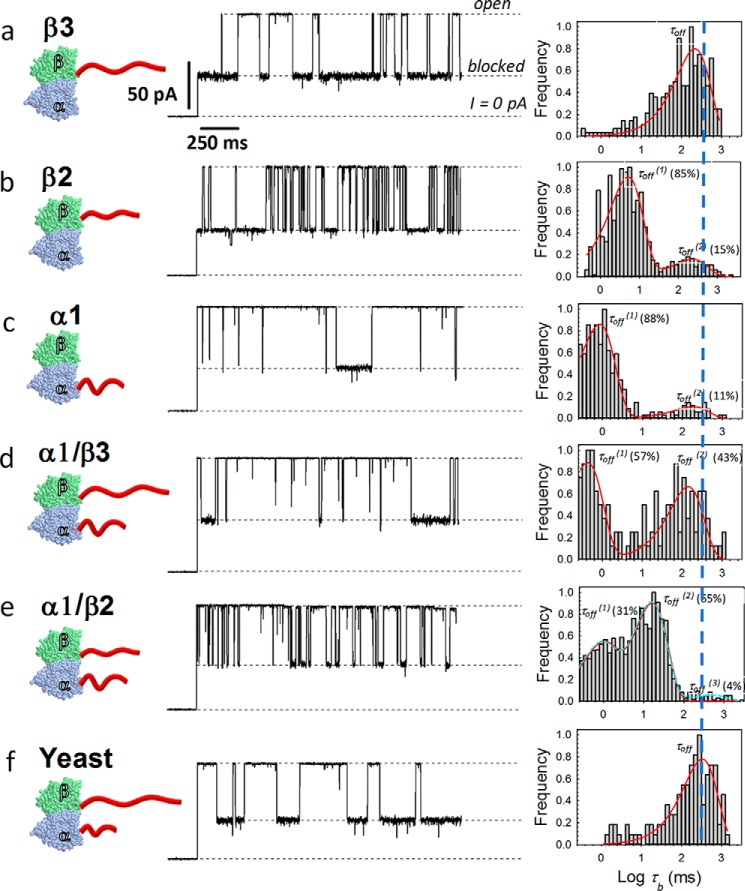
Figure 3.
Kinetic analysis of VDAC blockage by individual tubulin constructs. Left column, a–f, cartoons illustrating recombinant tubulins with human β3, β2, α1, α1/β3, α1/β2, and yeast CTTs (red). Middle column, representative traces of ion currents through a single VDAC channel in the presence of 8–10 nm recombinant tubulin construct shown at the left. All records were taken at −27.5 mV of applied voltage; constructs were added to the cis compartment. Other experimental conditions are as in Fig. 1. Right column, corresponding log-binned distributions of blockage times, τb, calculated from statistical analysis of current records, fragments of which are shown in the middle. Red solid lines are the single exponential fits with characteristic time τoff = 〈τb〉 equal to 242 and 330 ms for β3 and yeast tubulin WT (a and f) or double exponential fits with characteristic times τoff(1) and τoff(2) equal to 5 and 229 ms for β2 (b), 0.9 and 184 ms for α1 (c), 0.4 and 142 ms for α1/β3 (d), and 0.8 and 16 ms for α1/β2 (e). The best fit (p < 1 × 10⁻⁵ using χ2 test) for the α1/β2 construct (e) is achieved with three exponents (dashed cyan line), where the minor third component (τoff(3) = 488 ms) accounts for 4% of events. The occurrence (%) of blockage times in the log-binned distribution of blockage times is shown in brackets for all double and triple exponential fits. The total number of events represented by histograms in a, b, c, d, e, and f are 362, 778, 618, 269, 1488, and 288, respectively.

