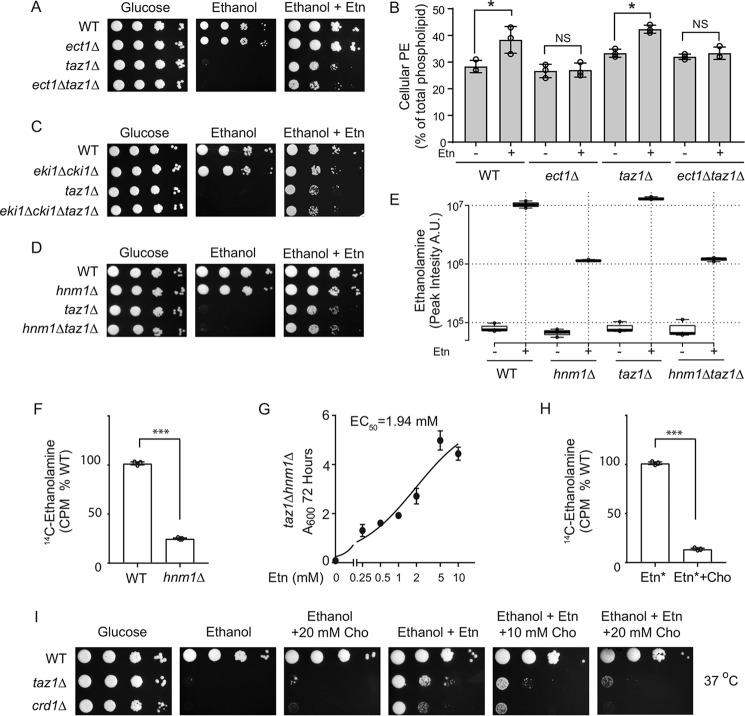
Figure 3.
Ethanolamine-mediated rescue of respiratory growth of CL-deficient cells is independent of PE biosynthesis. A, 10-fold serial dilutions of WT, ect1Δ, taz1Δ, and ect1Δtaz1Δ cells were seeded on to the indicated media, and images were captured after 2 days of growth on SC glucose and 7 days on SC ethanol ± 2 mm Etn at 37 °C. Data are representative of at least three independent experiments. B, total cellular PE levels of the indicated strains grown in SC ethanol ± 2 mm Etn. Data are expressed as mean ± S.D. (n = 3); *, p < 0.05, NS, not significant. C, 10-fold serial dilutions of WT, eki1Δcki1Δ, taz1Δ, eki1Δcki1Δtaz1Δ. D, WT, hnm1Δ, taz1Δ, and hnm1Δtaz1Δ cells were seeded onto the indicated media, and images were captured after 2 days of growth on SC glucose and 7 days on SC ethanol ± 2 mm Etn at 37 °C. Data are representative of at least three independent experiments. E, box plots of relative intracellular Etn abundance from WT, hnm1Δ, taz1Δ, and hnm1Δtaz1Δ grown in SC ethanol ± Etn. Etn levels were measured by LC-MS and expressed as peak intensity in arbitrary units (A.U.). Box plots show individual data points, median, first, and third quartiles, and greatest values within 1.5 inter-quartile range. Data are representative of at least three independent experiments. Data are expressed as mean ± S.D. (n = 3). F, WT and hnm1Δ cells were labeled with 1 μCi of [14C]Etn for 24 h, and radioactive Etn counts were measured in cpm (CPM) and expressed as % of WT. Data are expressed as mean ± S.D. (n = 3); ***, p < 0.001. G, growth of taz1Δhnm1Δ cells in SC ethanol with indicated concentrations of Etn (0–10 mm) was monitored by measuring absorbance at 600 nm at 72 h, and EC50 values for Etn were calculated using GraphPad Prism. Data are expressed as mean ± S.D. (n = 3). H, WT cells, grown in presence or absence of 10 mm choline, were radiolabeled with 1 μCi of [14C]Etn for 24 h, and intracellular radioactivity was measured and expressed as % of WT intensity. Data are expressed as mean ± S.D. (n = 3); ***, p < 0.001. I, 10-fold serial dilutions of WT, taz1Δ, and crd1Δ cells were seeded onto the indicated media, and images were captured after 2 days of growth on SC glucose and 7 days on SC ethanol ± Cho at 37 °C. Data are representative of at least three independent experiments.

