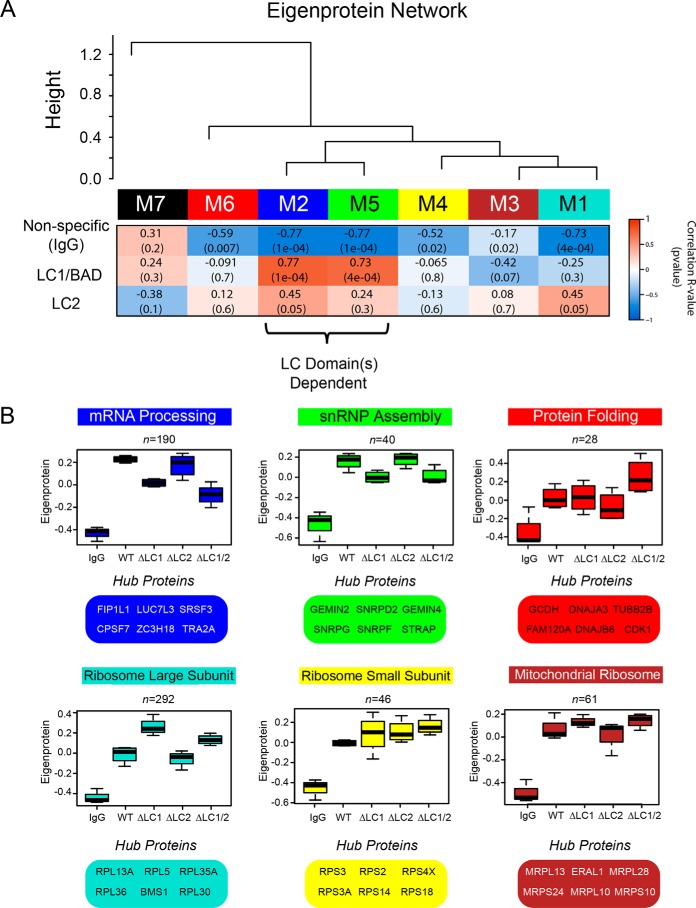
Figure 4.
Correlation network analysis resolves distinct modules of U1-70K-interacting proteins that differ in their association with the LC1/BAD domain. A, WGCNA-clustered proteins that were measured across all co-IP samples (n = 716) into modules (M1–M7) that represent classes of proteins defined by their correlation to each other across the five co-IP conditions analyzed (IgG, WT rU1-70K and deletions ΔLC1, ΔLC2, and ΔLC1 + ΔLC2). Listed in the heat map are bicor (R) correlations and p values defining the relationship between module eigenprotein level and rU1-70K LC domains (red is positively and blue is negatively correlated, respectively). B, eigenproteins, which correspond to the first principal component of a given module and serve as a summary abundance profile for all proteins within a module, are shown for six modules generated by WGCNA. Box plots with error bars beyond the 25th and 75th percentiles are shown for all five groups (IgG, WT, ΔLC1, ΔLC2, and ΔLC1 + 2). For each module, hub proteins are also enumerated below. Hub proteins are defined by high kME scores, which is a measure of how well a given protein matches that of the module eigenprotein, with high scores approaching one, signifying a high correlation (Table S1).

