Figure 8.
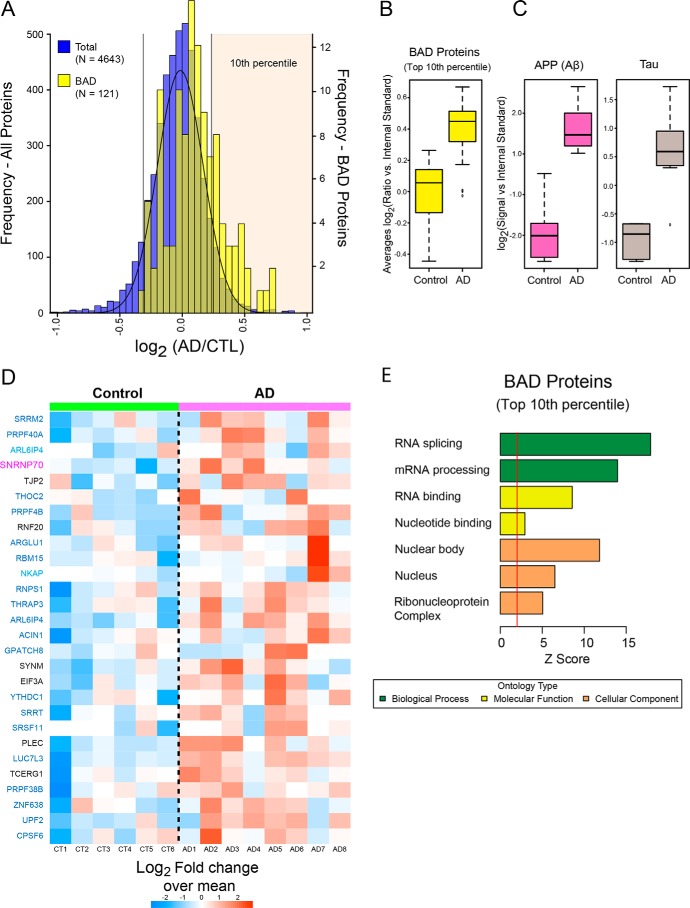
RNA-binding proteins with BAD domains have increased insolubility in AD brain. A, histogram of average log2 ratios (AD/control) for proteins measured in control (n = 6) and AD (n = 8) brain detergent-insoluble fractions. Protein ratios for all pairwise comparisons (i.e. control versus AD) were converted into log2 values, and the resulting histogram was fit to a normal Gaussian distribution. Compared with the normal distribution of all proteins in the AD insoluble proteome (blue histogram), quantified BAD proteins (n = 112 yellow histogram) showed a global shift toward insolubility in AD. BAD proteins in the top 10th percentile (n = 28) are significantly over-represented in the AD insoluble proteome (Fisher exact p value 2.0e-09). B, cumulative levels of the BAD proteins that fell into the top tenth percentile in control and AD samples. C, amyloid precursor protein (Aβ) and MAPT (Tau) protein levels in control and AD samples. The central bar depicts mean, and box edges indicate 25th and 75th percentiles, with whiskers extending to the 5th and 95th percentiles, excluding outlier measurements. D, heat map representing the fold-change over the mean of BAD proteins in the top 10th percentile across the control and AD cases. Gene symbols are displayed in text colored by their respective module color in the U1-70K interactome (black, not in a module). E, GO analysis of the 28 enriched BAD domain proteins highlights functions in RNA binding and processing. Significant over-representation of the ontology term is reflected with Z score greater than 1.96, which is equivalent to p < 0.05 (above red line).

