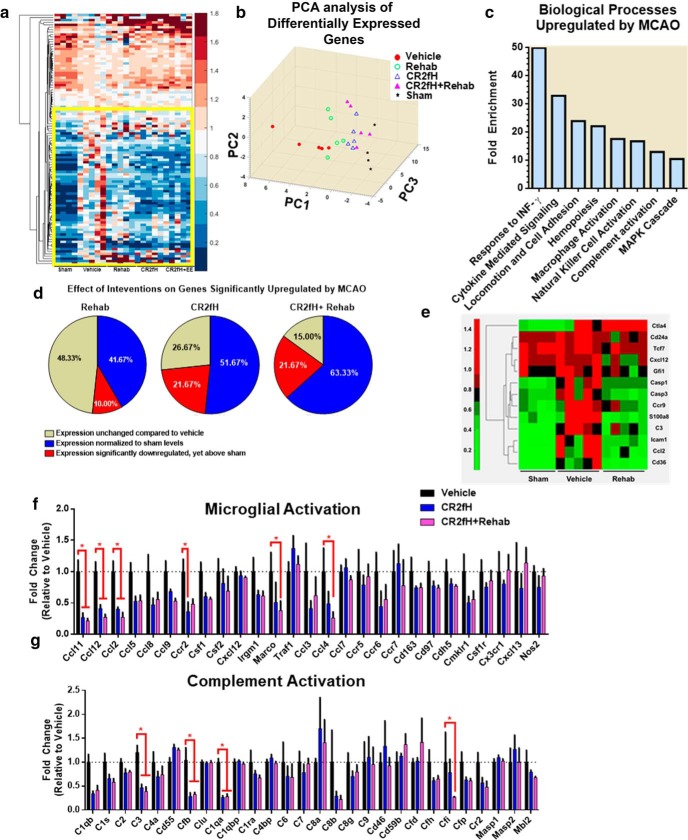
Figure 7.
Gene expression analysis of the impact of CR2fH and rehabilitation on immune-related genes in the ipsilateral hemisphere 5 d after stroke. a, Clustergram of differentially expressed genes on Nanostring immunology gene expression assay with a p < 0.05 on at least one comparison. A detailed network of gene expression changes is provided in Figure 7-1, Figure 7-2, and Figure 7-3. b, PCA of differentially expressed genes showing PC1–PC3, which explain 69% of the variance. c, Enrichment analysis of GO biological processes enriched in genes that are significantly upregulated in MCAO versus sham animals. Enrichment statistics were performed through PANTHER (Mi et al., 2016). Processes with p < 0.0001 are displayed. d, Clustergram of genes significantly upregulated or significantly downregulated in rehabilitation compared with vehicle (p < 0.05). e, Pie charts showing the distribution of genes dysregulated by MCAO according to their changes by the different treatment categories. f, g, Gene expression panels of genes involved in microglial/macrophage activation (f) and complement activation (g). Two-way ANOVA, Bonferroni's correction, n = 5/group, *p < 0.05.

