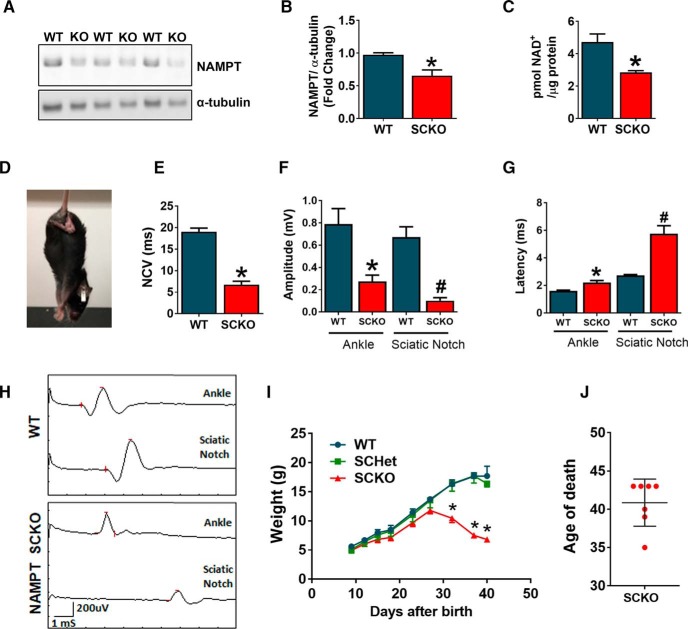
Figure 1.
SC-specific deletion of NAMPT leads to severe neuropathy. A, Western blot analysis of NAMPT expression and (B) quantification of fold change of NAMPT protein (normalized to α-tubulin) in sciatic nerves of P21 WT and NAMPT SCKO mice. *p = 0.0264, unpaired two-tailed Student's t test (n = 3 mice). C, NAD+ levels (pmol) normalized to protein levels in sciatic nerves from P28 WT and NAMPT SCKO mice were determined by LC-MS/MS. *p < 0.01, unpaired two-tailed Student's t test (n = 4 mice). D, Characteristic hindlimb clasping in a NAMPT SCKO mouse at 1 month of age. E, Nerve conduction velocity of WT and NAMPT SCKO mice at 35 d of age. *p < 0.0001, unpaired two-tailed Student's t test (n = 6 or 7 mice). F, Quantification of CMAP peak amplitude after ankle and sciatic notch stimulation of WT and NAMPT SCKO mice. *p = 0.008, compared with WT at the ankle. #p = 0.002, compared with WT at the sciatic notch using unpaired two-tailed Student's t test (n = 6 or 7 mice). G, Quantification of CMAP latency period after ankle and sciatic notch stimulation of WT and NAMPT SCKO mice. *p = 0.002, compared with WT at the ankle. #p = 0.0002, compared with WT at the sciatic notch using unpaired two-tailed Student's t test (n = 6 or 7 mice). H, Sample traces of CMAP recordings from the ankle and the sciatic notch in WT and NAMPT SCKO mice. Scale shown on the bottom left. I, Growth curves of WT and NAMPT SCKO mice showing weight loss beginning at 1 month of age. Two-way ANOVA (F(8,94) = 91.2, p < 0.0001 for time; F(8,94) = 91.2, p < 0.0001 for genotype; F(2,94) = 79.34, p < 0.0001 for interaction). *p < 0.0001, multiple comparisons with Tukey's post hoc test (n = 4–6 mice). J, NAMPT SCKO mice die ∼40 d of age. Data are mean ± SEM.

