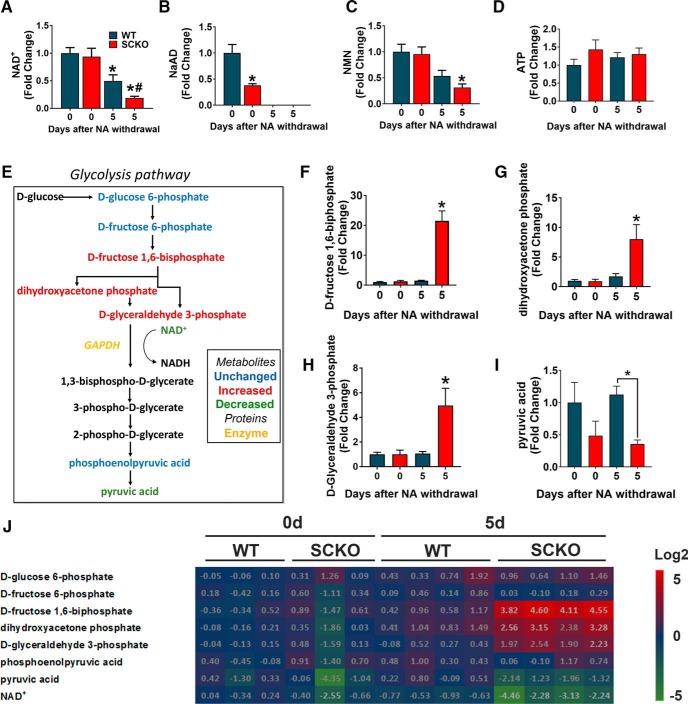
Figure 8.
NA administration rescues NAD+ deficiency in NAMPT SCKO nerves, and withdrawal leads to changes in glycolysis and the pentose phosphate pathway. A–D, The metabolite levels of NAD+ (A), NaAD (B), NMN (C), and ATP (D) at 0 and 5 d after NA withdrawal in P60 WT and NAMPT SCKO sciatic nerves treated with NA were determined by LC-MS/MS. Metabolite levels were normalized by the protein content in each sample and expressed relative to WT 0 d after NA withdrawal. A, One-way ANOVA (F(3,11) = 12.4, p = 0.0007). *p < 0.03, compared with WT with no NA withdrawal. #p = 0.0033, compared with NAMPT SCKO with no NA withdrawal (n = 3–5) with multiple comparisons with Sidak's post hoc test. B, One-way ANOVA (F(3,11) = 49.79, p < 0.0001). *p = 0.004, compared with WT with no NA withdrawal with multiple comparisons with Sidak's post hoc test (n = 3–5). C, One-way ANOVA (F(3,11) = 8.049, p = 0.0041). *p < 0.02, compared with WT or NAMPT SCKO with no NA withdrawal (n = 3–5). D, One-way ANOVA (F(3,11) = 0.8632, p = 0.4889), no significant difference (n = 3–5). E, The glycolysis pathway. Black represents metabolites that were not detected. Blue represents metabolites that were detected but not significantly changed. Green represents metabolites that were significantly downregulated. Red represents metabolites that were significantly upregulated in NAMPT SCKO sciatic nerves at 5 d after NA withdrawal (relative to WT 0 d after NA withdrawal). Legend shown at the bottom right corner. F–J, Ion abundance of each metabolites were normalized to the protein content and expressed relative to WT 0 d after NA withdrawal. The glycolysis intermediates (F) D-fructose 1,6-biphosphate, (G) dihydroxyacetone phosphate, and (H) d-glyceraldehyde 3-phosphate were all significantly upregulated in NAMPT SCKO sciatic nerves 5 d after NA withdrawal. I, Pyruvic acid is significantly decreased in WT versus SCKO nerves 5 d after NA withdrawal. F, One-way ANOVA (F(3,10) = 28.55, p < 0.0001). *p < 0.0001, compared with all other groups with multiple comparisons with Sidak's post hoc test (n = 3–5). G, One-way ANOVA (F(3,10) = 23.19, p < 0.0001). *p = 0.0004 (n = 3–5) compared with all other groups with multiple comparisons with Sidak's post hoc test. H, One-way ANOVA (F(3,10) = 23.54, p < 0.0001). *p = 0.0004 (n = 3–5) compared with all other groups with multiple comparisons with Sidak's post hoc test. I, *p = 0.03 (n = 3–5) compared between brackets with unpaired two-tailed Student's t test. J, Heat map displaying levels of glycolysis metabolites and NAD+ at 0 and 5 d after NA depletion. Each metabolite level was normalized to the average values of WT 0 d after NA withdrawal and log2 of fold changes are indicated by the number and color code. Data are mean ± SEM.

