
Figure 2.
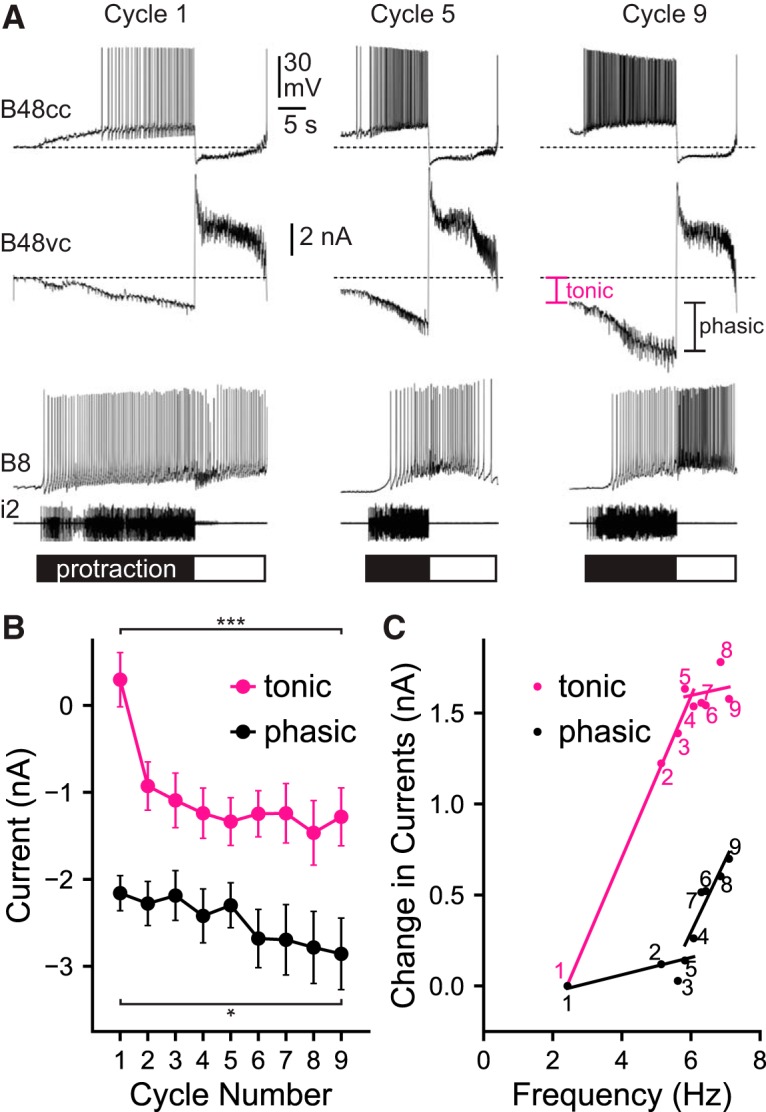
Currents induced in B48 during ingestive priming. A, A series of 9 cycles of motor activity were triggered by stimulating CBI-2 with a 30 s ICI. Cycles 1, 5, and 9 are shown. Top three traces represent, from top to bottom, a current-clamp recording from a B48 neuron (B48cc), a voltage clamp recording from the contralateral neuron clamped at −70 mV (B48vc), and an intracellular recording from the radula closer motor neuron B8. Bottom, Extracellular recording from the i2 nerve. Dotted lines that run through the B48cc recordings indicate the resting potential (−53 mV). Dotted lines that run through the B48vc recordings indicate the baseline holding current. Pink bar represents the sustained current that developed before cycle 9 (tonic current). Black bar represents the peak synaptic current induced during the protraction phase of cycle 9 (phasic current). As ingestive priming develops, there are progressive increases in the B48 firing frequency. Further, there are increases in both tonic and phasic currents (N = 7). B, Plot of cycle number versus tonic current (pink) or synaptic current (black). Priming produces a significant increase in both types of currents, but the increase in the tonic current is larger (N = 7). C, Data shown in B are replotted with the change in the magnitude of the current on the ordinate and the B48 firing frequency on the abscissa. Mean values are plotted for each cycle number, and error bars are omitted for clarity. Data were divided into two groups: data for cycles 1–4 and data for cycles 5–9. Each group was fit with a line and the slope calculated as described in the text (N = 7). ***p < 0.001, *p < 0.05.