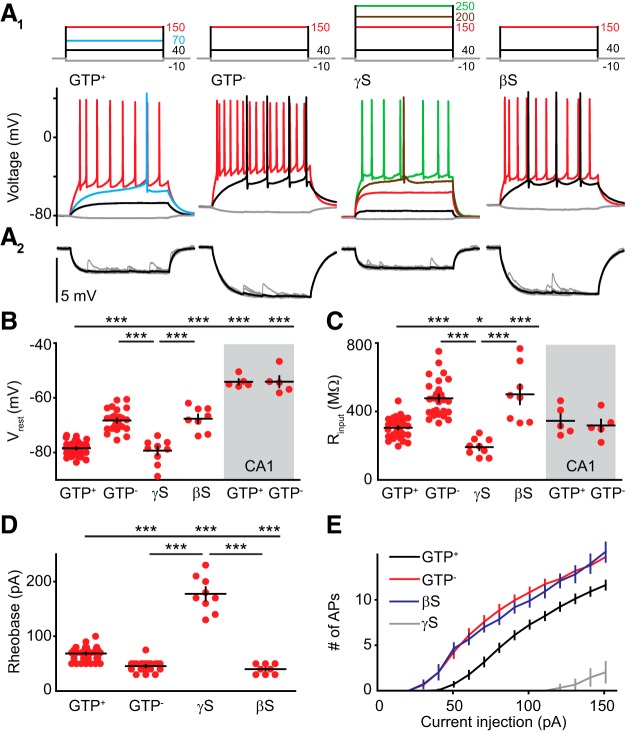
Figure 1.
Intact G protein signaling is required for low GC intrinsic excitability. A1, Top, Current injections (500 ms) used to measure GC intrinsic excitability with different intracellular solutions. Bottom, Voltage responses with color indicating current injections shown above. A2, Enlarged voltage response evoked by a 10 pA hyperpolarizing current injection used to calculate input resistance. Average of 50 traces in black. B–D, Comparison of properties from GCs and CA1 pyramidal cells. B shows (from left to right) RMP from 38, 26, 9, and 8 GCs, and 5 and 5 CA1 pyramidal cells (shaded area) recorded with the internal shown below. ***Top bar showing differences vs GTP+. Differences between CA1 cells and GCs not shown (see Results). ANOVA, F(5,85) = 99.63. C shows input resistance from the same cells as B. ANOVA, F(5,85) = 20.24. D shows the current threshold to elicit the first spike for the GCs in B. ANOVA, F(3,71) = 172.1. E, Number of spikes elicited by increasing current steps measured during 500 ms. GTP+, n = 27; GTP−, n = 16; GTPγS. n = 9; GDPβS, n = 7. Data are the mean ± SEM (lines) and individual values (symbols). Bonferroni's post hoc test: ***p < 0.001; **p < 0.01; *p < 0.05.

