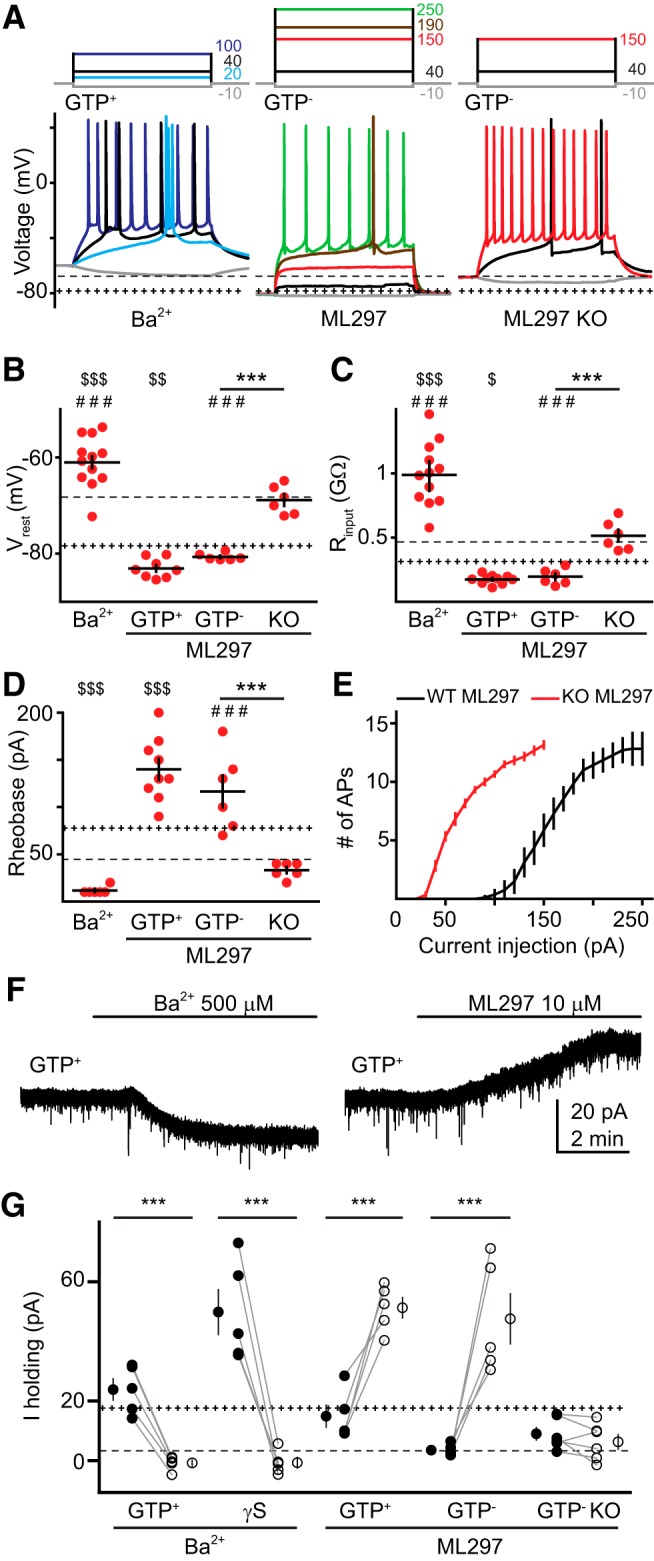
Figure 3.

GIRK modulators affect mature GC intrinsic properties. A, Current injections (top, 500 ms) and voltage responses (bottom) in GCs with the indicated intracellular solution and Ba2+ (500 μm) or ML297 (10 μm). Right, ML297 had no effect on GCs from GIRK2 KO mice. Dotted + and − lines represent mean values from GTP+ and GTP− conditions shown in Figure 1, respectively. B–D, Individual (red) and mean (black) values of RMP (B), input resistance (C), and rheobase (D) recorded in GCs perfused with Ba2+ (GTP+) or ML297 (GTP+, GTP−, and GIRK2 KO mice). ANOVA: F(5,50) = 62.28, F(5,51) = 49.69, and F(5,50) = 42.26 for B–D, respectively. Bonferroni's post hoc test: ***p < 0.001; **p < 0.01; *p < 0.05; $ indicate differences against GTP+ pool; # indicate differences against GTP−. E, Number of APs evoked by increasing current injections measured over 500 ms after perfusing ML297 in WT and GIRK2 KO GCs (n = 8 and 6, respectively). F, Representative currents (held at −70 mV) −70 mV) evoked by Ba2+ or ML297 using a GTP+ intracellular solution. G, The effect of Ba2+ or ML297 (open symbols) on outward currents (I holding) using the indicated internal solutions and GIRK2 KO mice. Dotted + and − lines represent mean standing outward current from 15 GCs using GTP+ intracellular (18 ± 2 pA) and 11 GCs using GTP− intracellular solution (4 ± 0.7 pA). Paired t test, ***p < 0.001. Single symbols represent the mean ± SEM and individual paired values are connected with lines.
