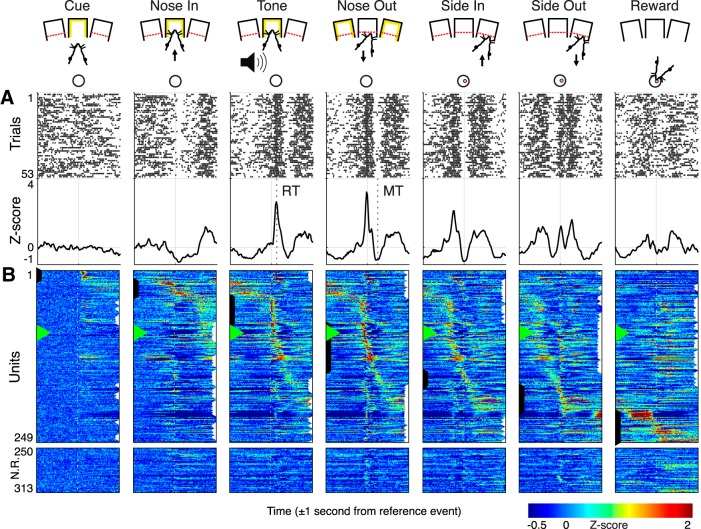
Figure 2.
Single-unit Mthal activity during task performance. A, Single-unit raster (top) and PETHs (bottom) of a Nose Out responsive unit. Vertical dashed lines indicate the median RT (132 ms) and MT (249 ms) in this session. B, PETHs for all units sorted by their primary unit class and the timing of their maximal Z-score. Black and white arrows along the column edges indicate the primary and secondary unit classification, respectively. Green triangles in B indicate the unit from A.

