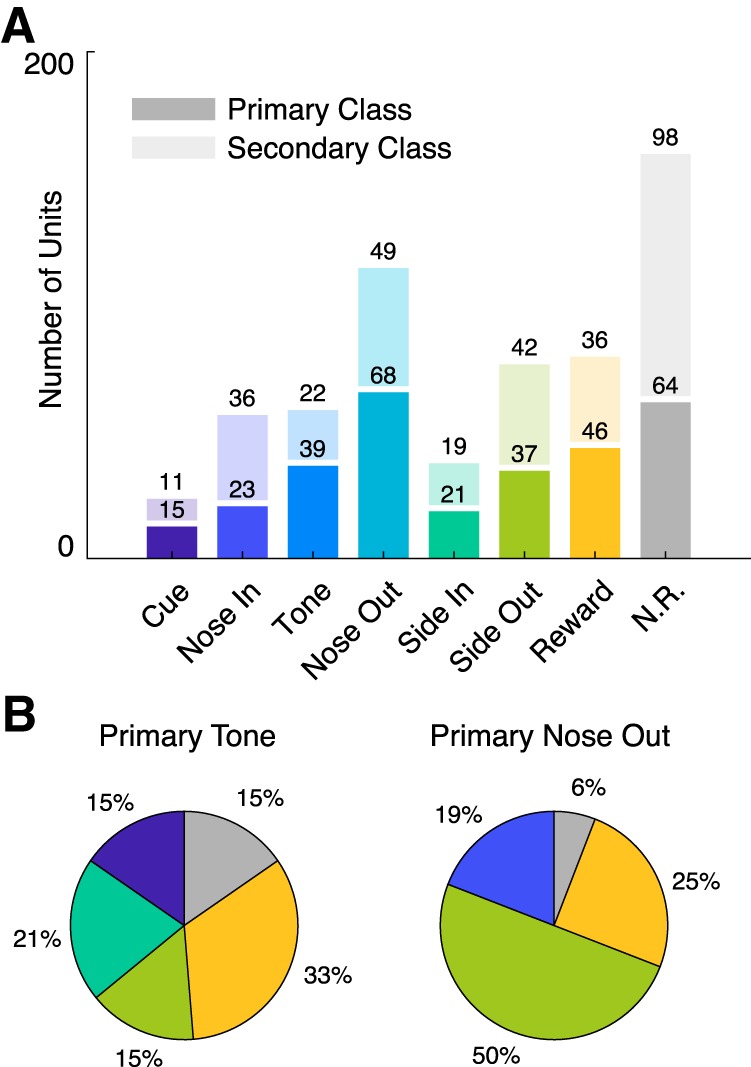
Figure 3.

Numbers of units with activity time-locked to behavioral events. A, Distribution of primary (bottom, dark bars) and secondary (top, light bars) unit classes. Numbers above each bar indicate the number of units preferentially locked to each event. B, Distributions of secondary events for primary Tone (left) and Nose Out (right) units. Tone units show an approximately equal preference for firing at other events while Nose Out units are highly modulated at Side Out.
