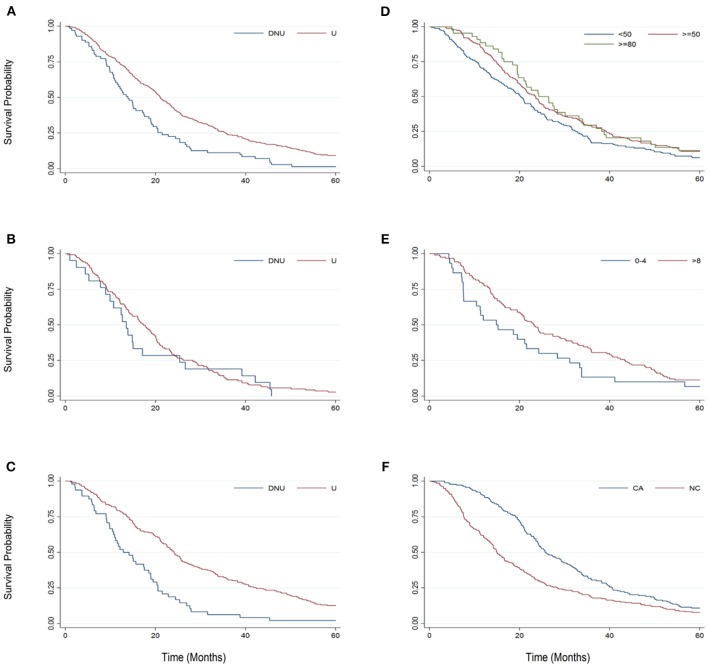
Figure 2.
Kaplan-Meier graphs comparing survival probability from 0 to 60 months from baseline for key sub-group pairings. (A) Bi-PAP users (U) and non-users (DNU). (B) Bulbar onset Bi-PAP users (U) and non-users (DNU). (C) Limb onset Bi-PAP users (U) and non-users (DNU). (D) BiPAP users classified by the FVC %predict at which they initiated Bi-PAP: <50, ≥50, and ≥80. (E) Bi-PAP users classified by their Bi-PAP daily usage time: <4 h/day and ≥ 8 h/day. (F) BiPAP users who also used cough assist (CA) or never used cough assist (NC).

