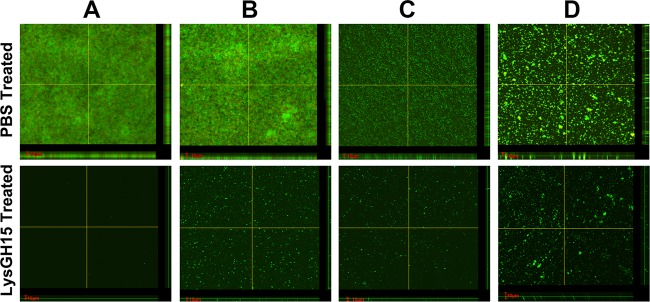
FIG 4.
CLSM analysis of biofilms. Micrographs show biofilm formation by S. epidermidis SE009 (A), S. aureus R066 (B), S. hominis SWS11 (C), and S. haemolyticus SW053 (D) after incubation for 24 h followed by treatment with LysGH15 (150 μg/ml) or PBS for 1 h. The biofilms produced by the strains were assessed using LIVE/DEAD staining. The bars represent 10 μm. The images were obtained using CLSM.

