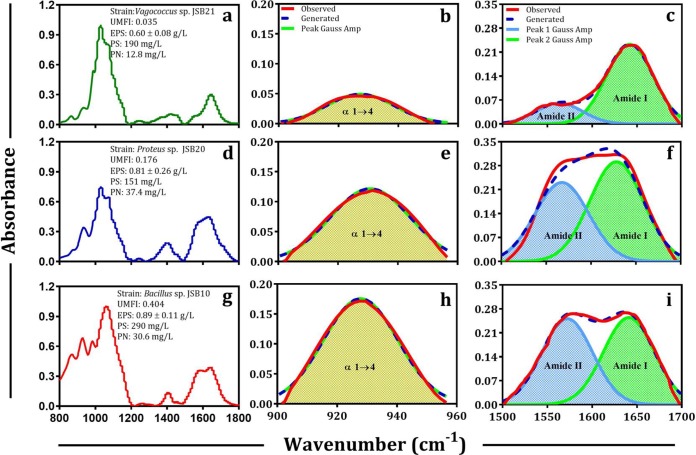
FIG 2.
FTIR spectra of bound EPS of low-fouling (a), medium-fouling (d), and high-fouling (g) bacteria are shown. Second derivative revolution enhancement and curve-fitted (r2 0.999, interactions [number of iterations in the fitting] = 7) polysaccharide (b, e, and h) and protein (c, f, and i) region of bound EPS of respective strains are shown. The curve-fitted spectra (r2 0.99 to 0.999, interactions = 7) were obtained by the Fourier deconvolution of Gaussian instrument response function, followed by application of the AutoFit Peaks II second derivative function for the polysaccharide region (b, e, and h), and the AutoFit Peaks III deconvolution function for protein regions (c, f, and i). UMFI, unified membrane fouling index; PS, EPS-polysaccharide; PN, EPS-protein.

