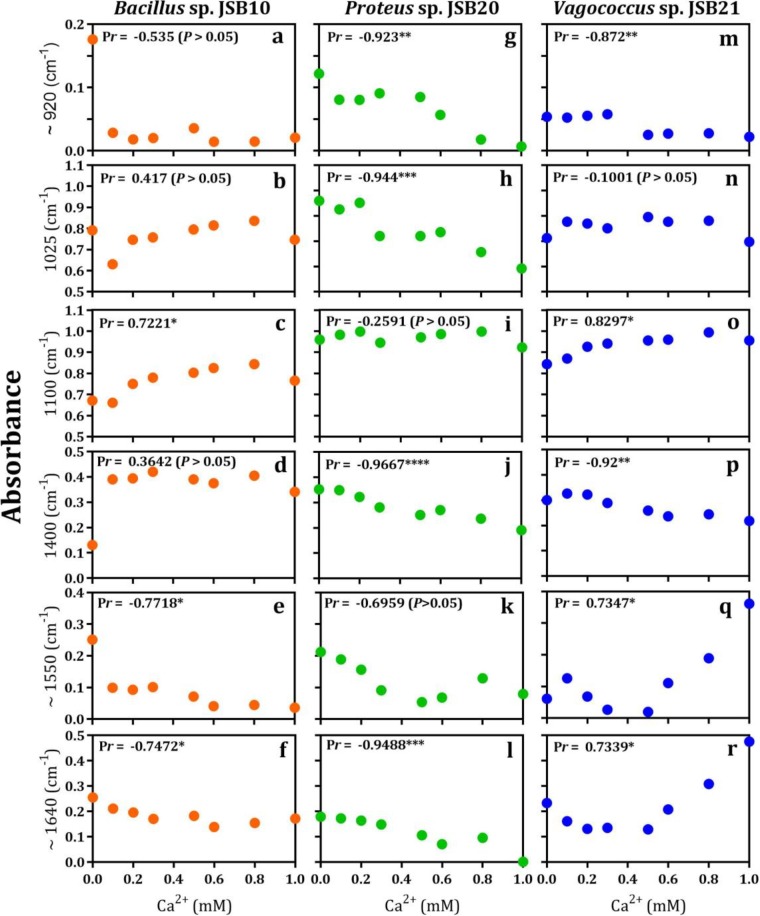
FIG 7.
Changes in the absorbance of FTIR spectra of functional groups of EPS-Ca2+ complexes of monospecies cultures: high-fouling (Bacillus sp. JSB10) (a to f), medium-fouling (Proteus sp. JSB20) (g to l), and low-fouling (Vagococcus sp. JSB21) (m to r) bacteria. The curve-fitted spectra (r2, 0.99 to 0.999, interactions = 7) were obtained by Fourier deconvolution of Gaussian instrument response function, followed by the application of AutoFit Peaks II second derivative function for an α-1,4-glycosidic bond and AutoFit Peaks III deconvolution function for amide I and amide II functional groups. P values (one-tailed) at a 95% confidence interval were as follows: *, P < 0.05; **, P < 0.005; ***, P < 0.0005; ****, P < 0.0001.

