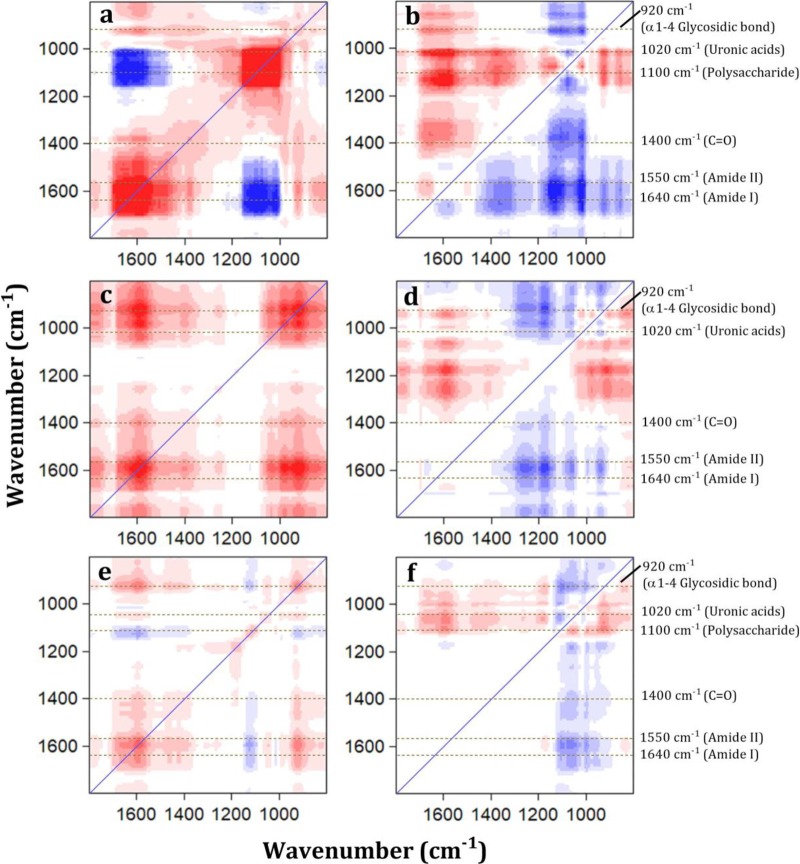
FIG 8.
Two-dimensional correlation maps (synchronous and asynchronous) generated from the 800 to 1,800 cm−1 region of the FTIR spectra of EPS-Ca2+ complexes of high-fouling (Bacillus sp. JSB10) (a and b), medium-fouling (Proteus sp. JSB20) (c and d), and low-fouling (Vagococcus sp. JSB21) (e and f) bacteria. The concentration of calcium used was in the range of 0 to 1.0 mM. Red and blue represent positive and negative correlations, respectively. A greater color intensity indicates a stronger correlation, and a weaker color intensity indicates a weaker correlation.

