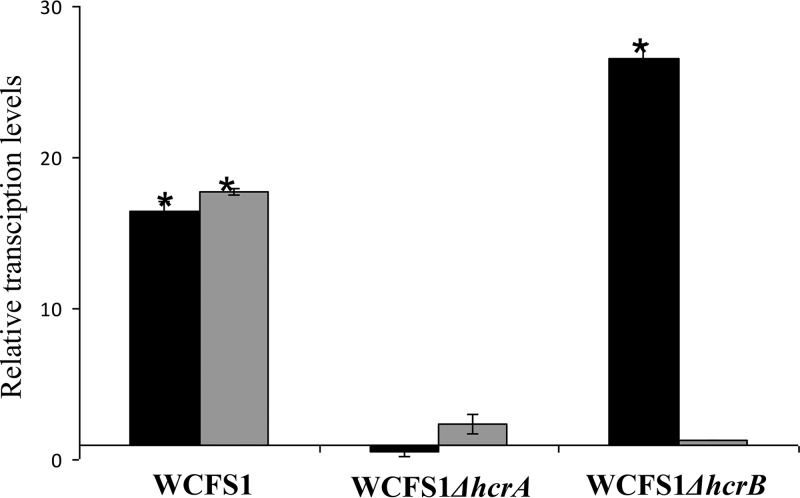
FIG 3.
Relative expression levels of hcrAB genes in hcr knockout mutants in response to 1.5 mM m-coumaric acid. Expression levels were calculated with the 7500 Fast system relative quantification software using L. plantarum ldh as the endogenous gene and growth in the absence of m-coumaric acid as a growth condition calibrator. Expression levels of hcrA and hcrB genes are represented by black and gray bars, respectively. The experiments were done in triplicate. The mean values and the standard errors are shown. *, P < 0.1.

