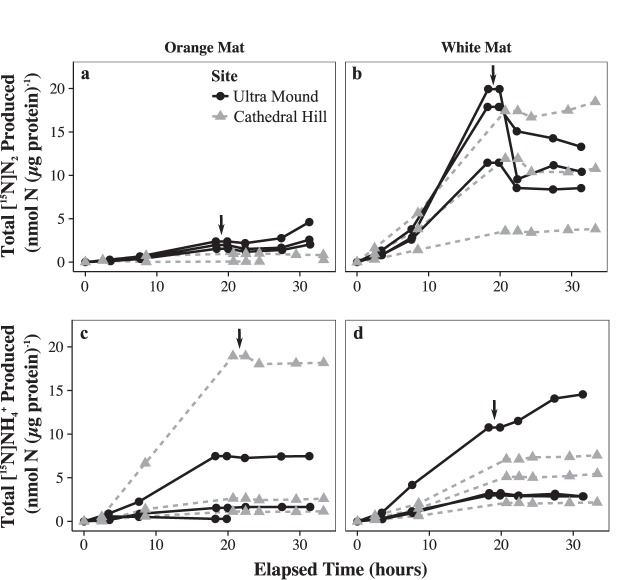
FIG 1.
Time series of cumulative [15N]NO3− reduction to [15N]N2 (a and b) and to [15N]NH4+ (c and d), normalized to protein content for each of the six orange (a and c) and six white (b and d) laboratory-incubated FLSB mat pieces. Each line represents an individual mat piece. The vertical black arrows indicate when the FLSB mats were destroyed at around 20 h of incubation.

