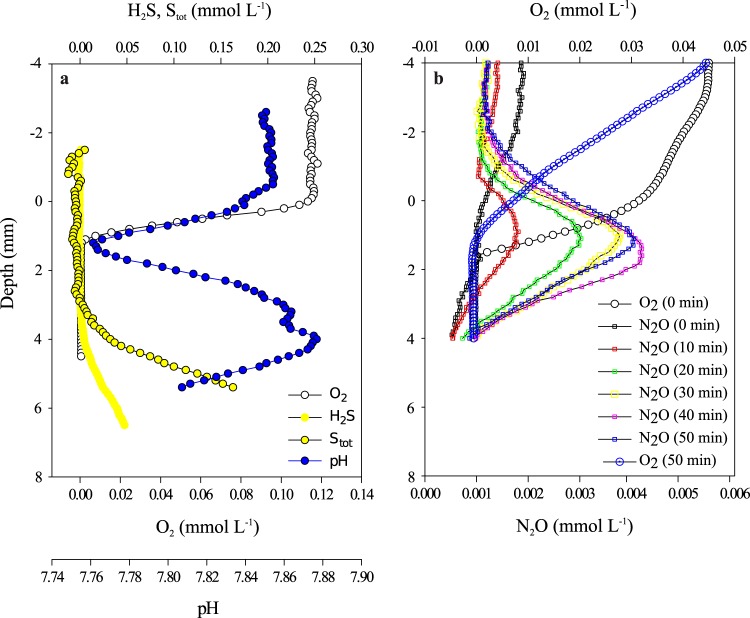
FIG 2.
Microsensor profiles in a white FLSB mat. The top of the mat was carefully observed and is located at depth 0.0 cm in the profiles. (a and b) Oxygen, H2S, total sulfides (Stot), and pH microsensor profiles (a), and oxygen and N2O microsensor profiles (b) measured at 10-min intervals from 0 to 50 min following the addition of acetylene.

