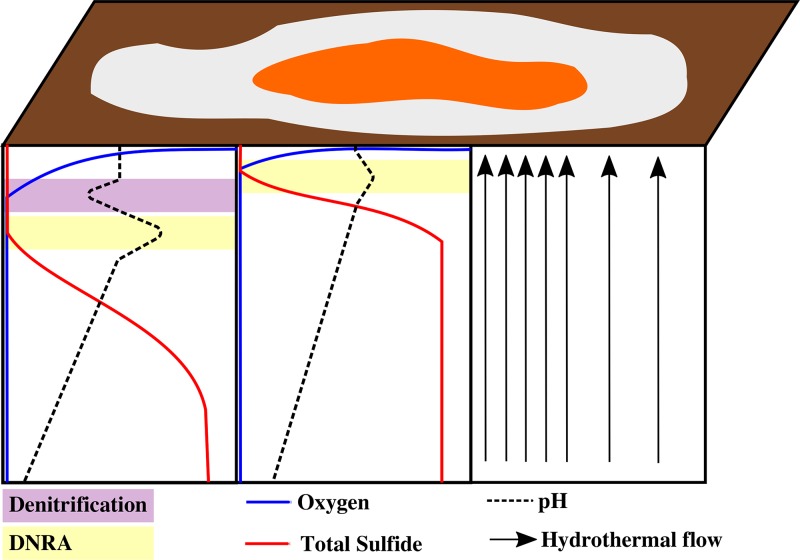
FIG 4.
Conceptual diagram of a Guaymas Basin FLSB mat with an orange center and a white periphery, surrounded by bare sediment (brown). The intensity of hydrothermal flow is represented by the density of black arrows. They show more intense hydrothermal flow under the center of the mat where the orange FLSB dominate and reduced hydrothermal flow under the mat periphery where white FLSB dominate. Idealized oxygen, total sulfide, and pH gradients in sediment beneath the mat center and periphery are displayed with arbitrary depth and concentration units. The purple and yellow zones show the relative positions of the dominant NO3− reduction pathways, denitrification and DNRA, respectively.

