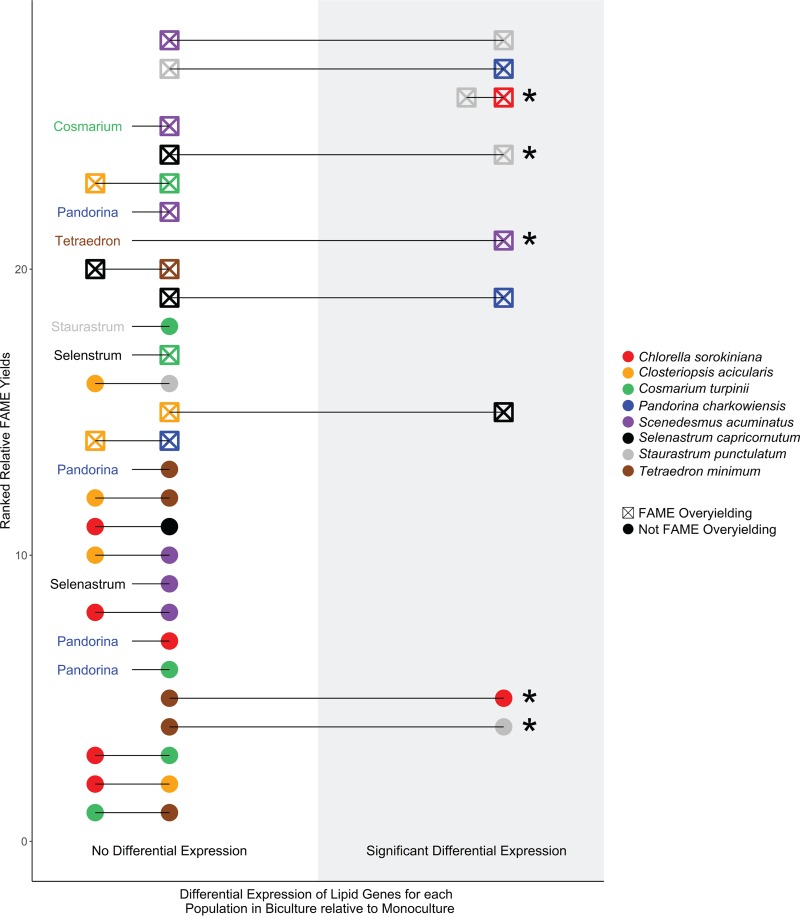
FIG 2.
Significant differential expression of lipid metabolism genes was observed only in communities overyielding in biomass quantity and/or quality. Solid lines connect populations growing together in biculture, symbol color indicates species identities in each biculture, and symbol fill indicates whether that biculture is overyielding in biomass quality (i.e., wt % FAMEs). Location on the x axis indicates whether those populations significantly differentially express their lipid genes via Kolmogorov-Smirnov tests on the distributions of log2-fold change values of lipid versus nonlipid genes. Populations differentially expressing their lipid genes and maintaining biomass at levels greater than those attained in monoculture are marked with asterisks. Bicultures are ranked from high (top) to low (bottom) on the y axis on the basis of their FAME yield in biculture relative to that in monocultures. Overyielding in FAME is designated where biculture yield was significantly higher than the average of the two monocultures. Missing symbol pairs are for those populations with insufficient gene-library sizes for inclusion in transcriptome analyses.

