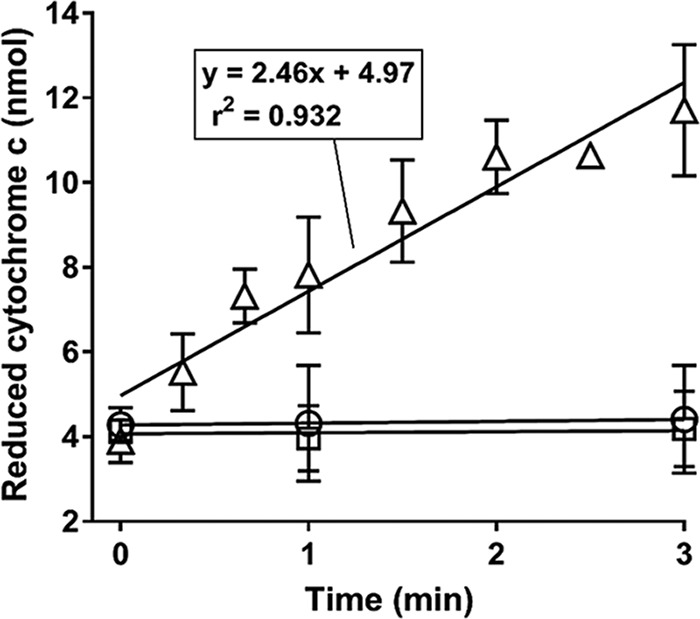
FIG 4.

Cytochrome c reduction activity of EtnD purified from E. coli. △, complete assay mixture; ○, assay mixture lacking EtnD; □, assay mixture lacking NADH. Symbols indicate the mean of three (○, □) or five (△) independent experiments, and error bars show the standard deviation.
