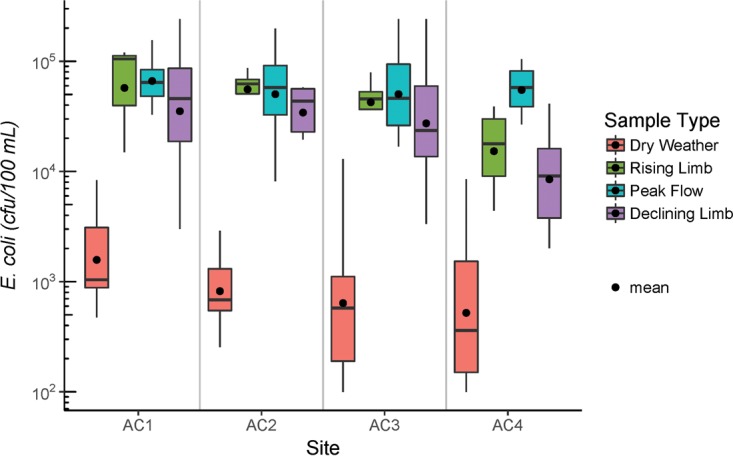
FIG 1.

Boxplot showing E. coli concentrations in Antelope Creek water under dry weather conditions and in the three stages under wet weather conditions. The bottom and top of each box represent the 25th and 75th percentiles, respectively. The bold line inside each box represents the median concentration, while the dot represents the average concentration. Whiskers on either side of each box represent data within 1.5 times of the interquartile range (25th percentile to 75th percentile).
