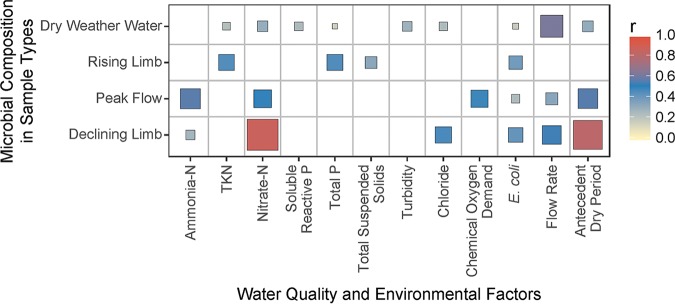
FIG 2.
Mantel test results showing significant correlation (P < 0.05) between weighted UniFrac distance for overall microbial community and Bray-Curtis dissimilarity coefficient for water quality parameters and environmental factors. The sizes of the boxes and the fill color both represent the r value. Boxes are shown only for significant correlations (P < 0.05).

