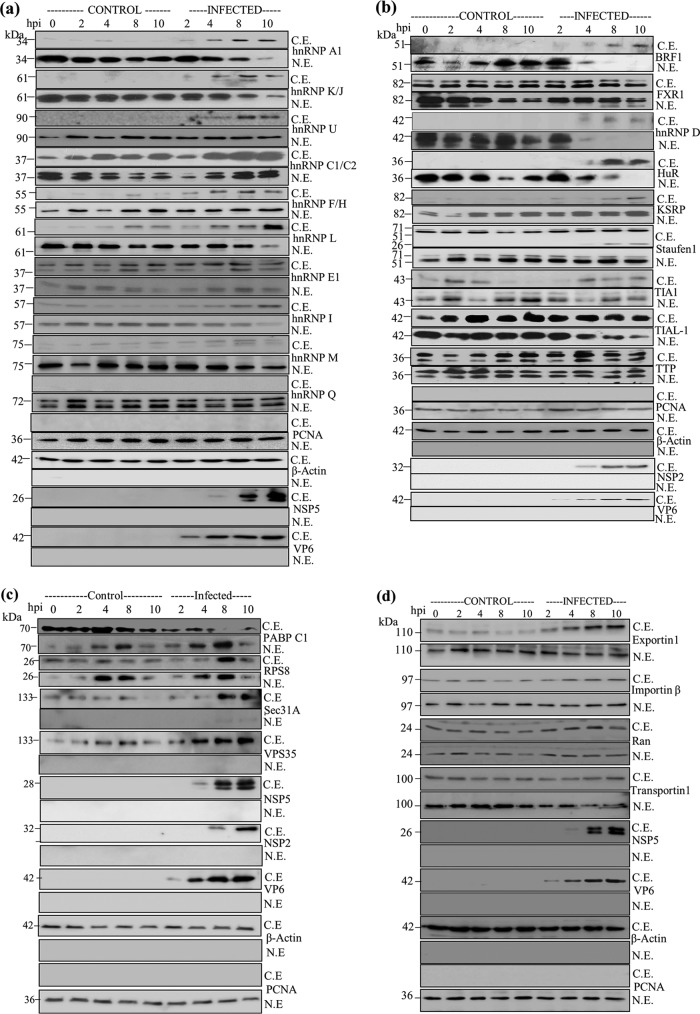
FIG 2.
Analysis of nuclear and cytoplasmic distributions of hnRNPs, ARE-BPs, and other proteins in mock-infected and rotavirus RRV-infected MA104 cells during the course of infection. (a) Time course immunoblot analysis of the levels of hnRNPs in the nuclear and cytoplasmic fractions. The samples in the lane from 0 hpi represent nuclear and cytoplasmic fractions from serum-grown control cells. Lanes from 2 to 10 hpi on the left represent mock-infected cells incubated for the indicated time periods in medium lacking serum, similar to the conditions under which virus infections were performed, and those on the right represents lysates prepared from RRV-infected cells (2 to 10 hpi). NSP5 was detected using protein A-agarose affinity-purified rabbit PAb generated against purified recombinant NSP5, and VP6 was detected using subgroup I MAb 631/9, which are very specific to the viral proteins, with no cross-reactivity to host proteins. β-Actin and PCNA were used to determine the purity of the cytoplasmic and nuclear fractions, respectively, and as internal loading controls. At each time point, 50 μg of the protein was analyzed. C.E., cytoplasmic extract; N.E., nuclear extract. (b) Analysis of the altered nuclear and cytoplasmic distributions of ARE-BPs during rotavirus infection. NSP2 and VP6 were detected using affinity-purified rabbit PAbs generated against purified NSP2 and RRV DLPs, respectively. For other details, see the legend to panel a. (c) Analysis of intracellular levels of host cytoplasmic proteins that interact with NSP5 and/or NSP2. See the legends to panels a and b for details. (d) Nuclear-cytoplasmic levels of nuclear transport proteins during rotavirus infection. Note the enhanced cytoplasmic retention of nuclear transport proteins during rotavirus infection in MA104 cells. ns, not significant. Other details are described in the legend to panel a. See Table S3 in the supplemental material for quantification of the changes in the protein levels in the nucleus and cytoplasm during the course of infection, and see Fig. S1 for changes in total protein levels.

