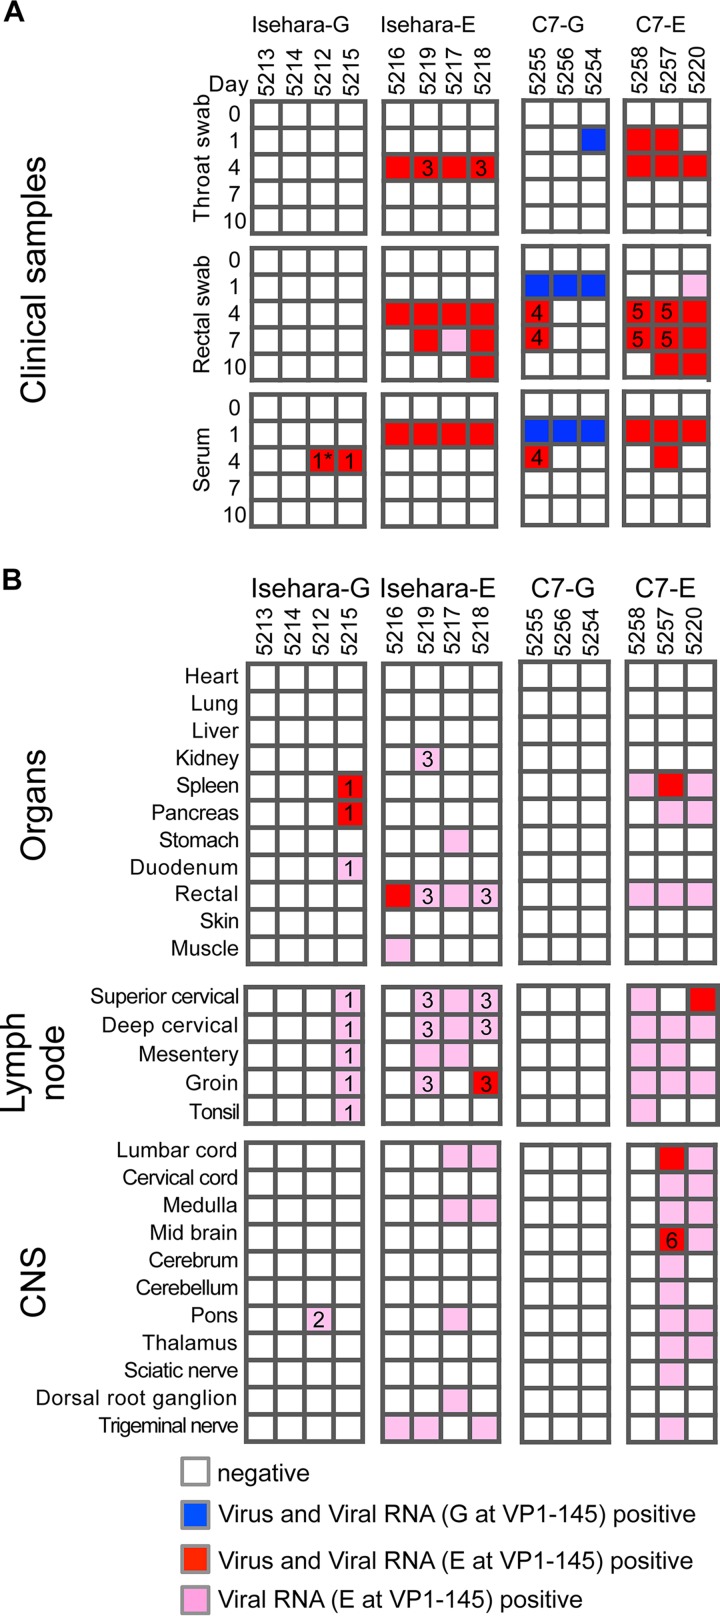
FIG 3.
Schematic illustration of EV71 detection. Virus isolation and viral RNA detection from clinical samples and autopsy samples are summarized. The VP1 region of the viral RNA was amplified, and the sequence was determined. The samples positive for virus isolation and viral RNA with G at VP1-145 are indicated by blue. The samples positive for virus isolation and viral RNA, or viral RNA alone, with E are indicated by red and pink, respectively. The numbers in the boxes indicate the samples containing mutations in the VP1 region, which are summarized in Table 1.

