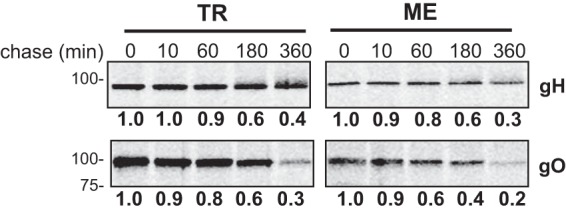
FIG 7.

Analysis of glycoprotein turnover in TR- and ME-infected cells. nHDF were infected with 1 PFU/cell of TR or ME. At 5 dpi, infected cells were metabolically labeled with [35S]cysteine-methionine for 15 min, and the label was then chased for 0, 10, 60, 180, or 360 min. Membrane proteins were extracted in 1% Triton X-100, adjusted to 2% SDS–30 mM DTT, heated to 75°C for 10 min, cooled to room temperature, and then diluted 35-fold. Immunoprecipitation was performed with anti-gH and -gO (TR- or ME-specific) antibodies, and precipitated proteins were analyzed by SDS-PAGE. Band densities were determined relative to the 0-min chase time. Results shown are representative of data from 4 independent experiments.
