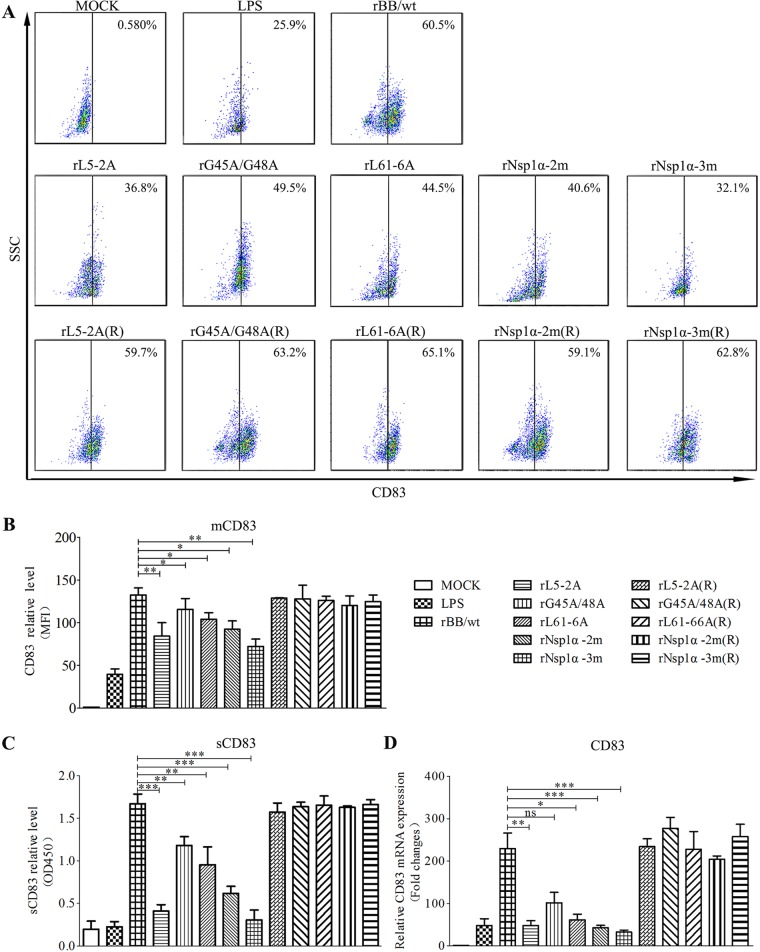
FIG 8.
Effect of nsp1α mutations on CD83 expression. (A) MoDCs were mock infected or infected with PRRSV mutants [rL5-2A, rG45A/G48A, rL61-6A, rNsp1α-2m, rNsp1α-3m, rL5-2A(R), rL61-6A(R), rG45A/G48A(R), rNsp1α-2m(R), and rNsp1α-3m(R)] at an MOI of 1 in the presence of LPS (10 μg/ml). After 24 h, cells were analyzed for surface CD83 (mCD83) expression by flow cytometry. Cells were stained with an isotype-matched control antibody. (B) Mean fluorescence intensity (MFI; y axis) values are shown for each virus. (C) Culture supernatants were collected and sCD83 was analyzed by ELISA. (D) CD83 mRNA levels were determined by qRT-PCR. All assays were repeated at least three times, with each experiment performed in triplicate. Bars represent means ± SEM from three independent experiments. ***, P < 0.001; **, P < 0.01; *, P < 0.05.

