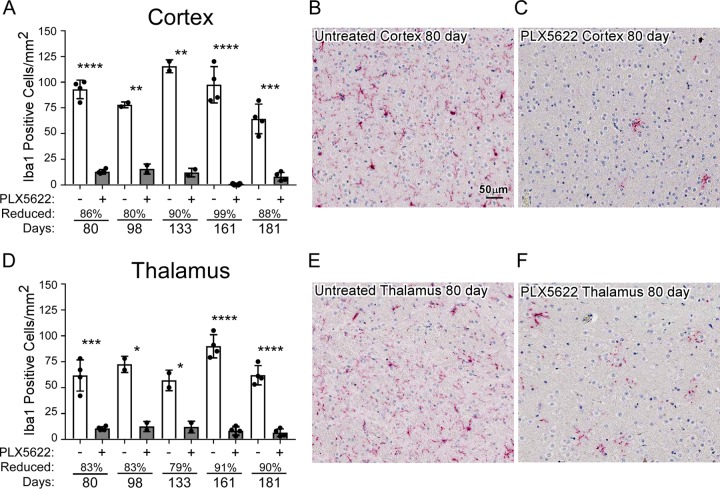
FIG 1.
Long-term reduction of microglia with PLX5622 treatment. Mice injected with NBH were continually fed control chow (untreated, PLX5622 [−]) or chow supplemented with PLX5622 (+) for up to 181 days. Similar paraffin-embedded sections of cortex and thalamus were fixed and stained with antibody to Iba1. Iba1-positive cells were enumerated at 80, 98, 133, 161, and 181 days posttreatment and reported as the number of positive cells per square millimeter (A and D). The white columns represent the mean number of Iba1-positive cells in mice fed control chow (PLX5622 −), and the gray columns represent the mean numbers of Iba1-positive cells in mice fed PLX5622 chow (PLX5622 +). Each dot represents an individual mouse. Error bars represent 1 standard deviation. The percent reduction with treatment for each time point relative to control is given. Untreated and PLX5622-treated groups at each time were compared by unpaired t test: *, P ≤ 0.05; **, P ≤ 0.01; ***, P ≤ 0.001; ****, P ≤ 0.0001. For a visual reference, representative images depicting approximately one-quarter of the counting area of the cerebral cortex (B and C) and thalamus (E and F) at 80 days are shown at the scale indicated in panel B.

