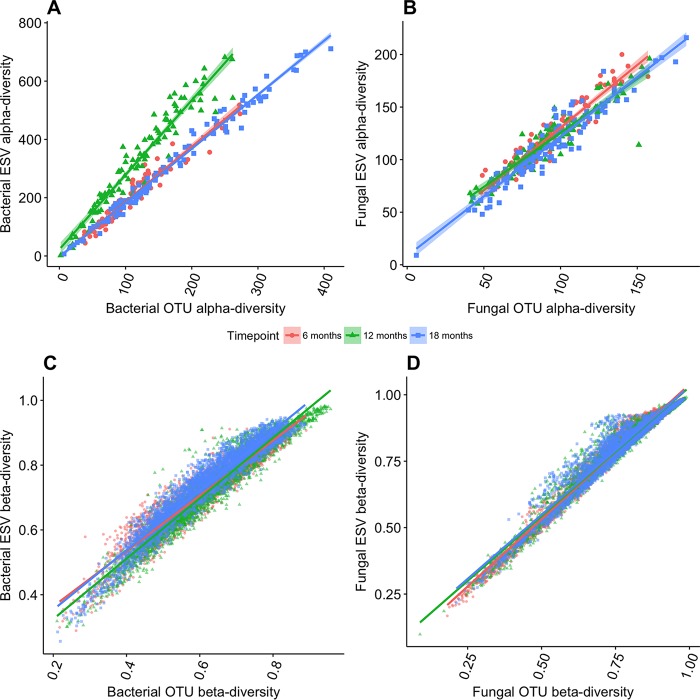
FIG 1 .
(A and B) Comparison of observed α diversity for (A) bacteria and (B) fungi as assayed by the richness of 97% similar operational taxonomic units (OTUs) versus exact sequence variants (ESVs). Numbers are total observed richness after normalizing to 10,000 sequences per sample from three time points (16, 12, and 18 months). (C and D) Comparison of observed β diversity for (C) bacteria and (D) fungi as assayed by the Bray-Curtis dissimilarity for OTUs versus ESVs from three time points (16, 12, 18 months).

