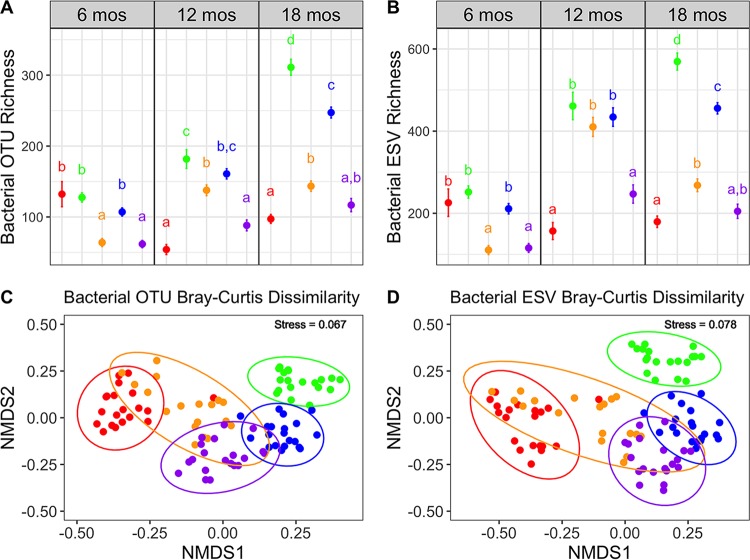
FIG 2 .
(A and B) Comparison of α diversity results using (A) operational taxonomic units (OTUs) versus (B) exact sequencing variants (ESVs) for bacteria across the elevation gradient at three time points (16, 12, and 18 months). Each point represents mean observed richness per litterbag per site, and lines indicated standard error (averaged across five inoculum treatments and four replicates; n = 20). Letters represent Tukey’s honestly significant difference (HSD) test significant differences across sites within a time point. (C and D) Comparison of β diversity results using nonmetric multidimensional scaling (NMDS) ordination of Bray-Curtis community dissimilarity of (C) bacterial OTUs and (D) bacterial ESVs colored by site at the final time point (18 months). Ellipses represent 95% confidence intervals around the centroid. Colors represent sites along the elevation gradient ranging from the lowest elevation (red = 275 m) to highest elevation (purple = 2,240 m), with middle elevation sites colored as follows: green = 470 m, orange = 1,280 m, and blue = 1,710 m.

