FIGURE 1.
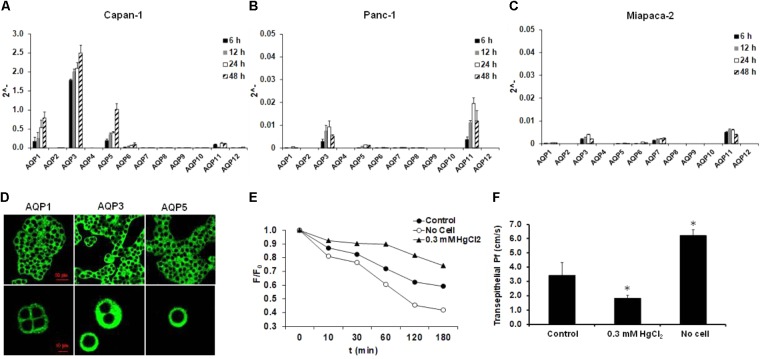
Expression and activity of AQPs in pancreatic ductal cells. Expression of different AQP isoforms was investigated by real-time PCR in (A) Capan-1, (B) Panc-1, and (C) Miapaca-2 pancreatic ductal cell lines, 6, 12, 24, and 48 h after the plating the cells. Data represent mean ± SEM of three, independent experiments. (D) Immunofluorescence staining of Capan-1 cells using FITC-conjugated anti-AQP1, -3, and -5 antibodies. (E) Osmotic water movement was investigated in Capan-1 cells. Representative graph shows changes in the fluorescence intensity of the apical solution, at different time points, in the present (triangle) and absence (black circle) of luminal HgCl2 (0.3 mM). To estimate the changes, the fluorescence intensity (F) was normalized to the initial value (F0). Transwell without cells was used for absolute positive control (open circle). (F) Summary of the Pf values obtained from the experiments in (E). Data represent mean ± SEM of three, independent experiments. ∗p ≤ 0.05 vs. Control.

