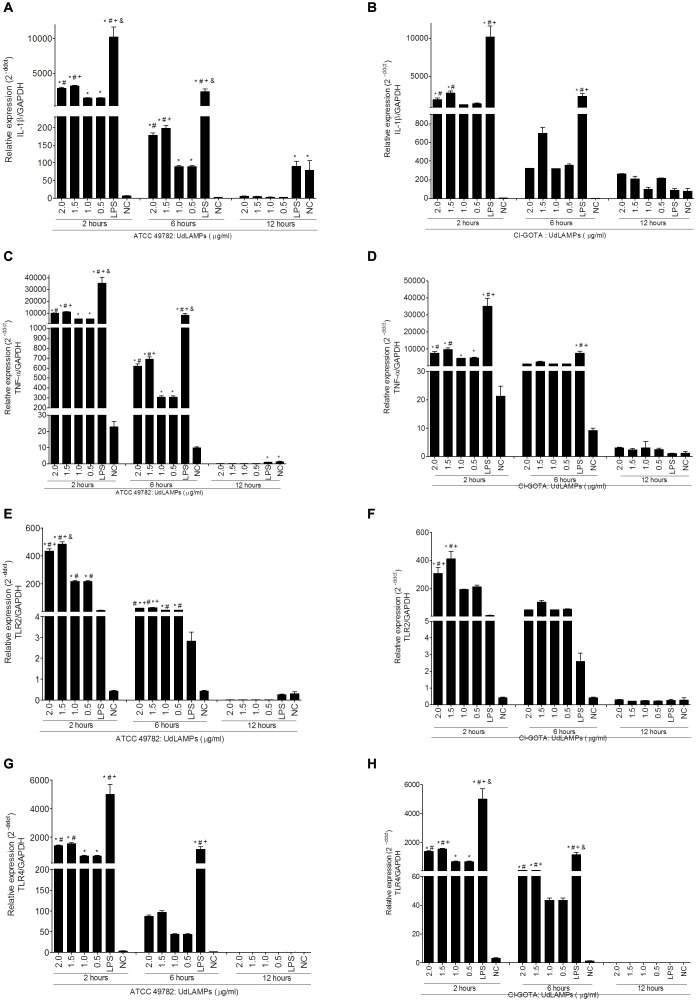
FIGURE 4.
Gene expression in bovine macrophages induced by different concentrations of UdLAMPs after 2, 6, and 12 h of inoculation. (A) IL-1β gene expression incubation with UdLAMPs of ATCC 49782 strain. (B) IL-1β gene expression after incubation with UdLAMPs of the CI-GOTA strain. (C) TNF-α gene expression after incubation with UdLAMPs of ATCC 49782 strain. (D) TNF-α gene expression after incubation and others with UdLAMPs of CI-GOTA strain. (E) TLR2 gene expression after incubation with UdLAMPs of ATCC 49782 strain. (F) TLR2 gene expression after incubation with UdLAMPs of CI-GOTA strain. (G) TLR4 gene expression after incubation with UdLAMPs of ATCC 49782 strain. (H) TLR4 gene expression after incubation with UdLAMPs of CI-GOTA strain. Treatments were compared using Kruskal-Wallis non-parametric test followed by the Dunn post-test. PBS was used as negative control (CN) and 100 ng/mL of LPS was used as positive control. Statistically different groups are those presenting different symbols. Statistical significance (p < 0.05) is represented by the symbols (∗difference with the NC group, #difference with the 1,5 mg/ml group, +difference with the 1,0 mg/ml group, &difference with the 0,5 mg/ml group). Data are expressed as mean ± standard deviation (n = 9).

