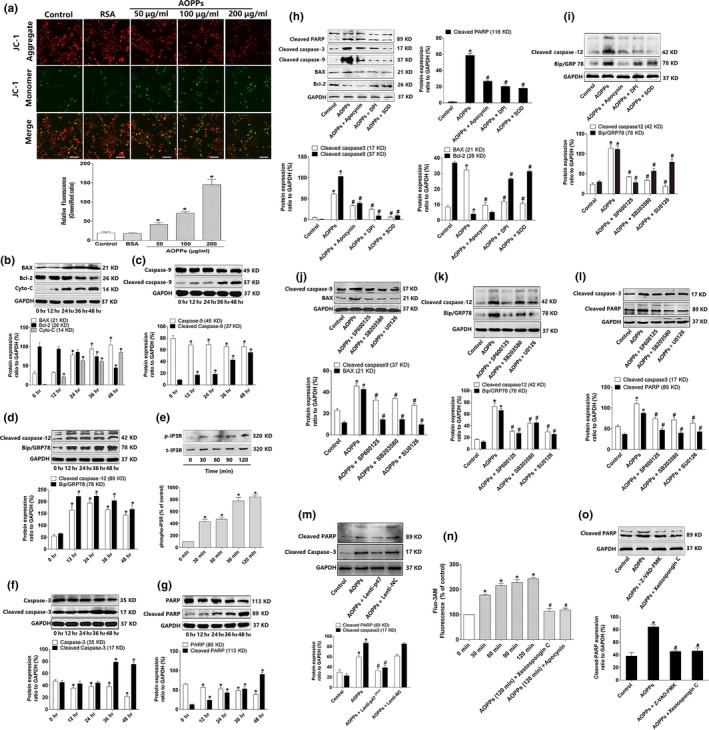
Figure 4.

AOPPs triggered intrinsic apoptosis pathway by NADPH oxidase‐dependent, MAPK signaling. (a) Confocal microscopy analysis using JC‐1 staining revealed that AOPP challenge for 24 hr decreased the ▵Ψm level of MC3T3‐E1 cells in a dose‐dependent manner (Bar = 100 μm). Numerical data were expressed in terms of the ratio of JC‐1 aggregates to JC‐1 monomers, the increased ration stand for the decreased ▵Ψm. (b–g) AOPP treatment (200 μg/ml) significantly increased the expression of BAX, cytochrome c, cleaved caspase‐9, cleaved caspase‐12, BiP/GRP78, phosphorylated Ca2+ channel IP3R, cleaved caspase‐3, and cleaved PARP, while decreased the expression of Bcl‐2, intact caspase‐9, intact caspase‐3, and intact PARP in 48 hr. (h,i) Pretreated with apocynin (100 μm), DPI (10 μm), and SOD (50 U/ml) significantly decreased AOPP‐induced (200 μg/ml, 48 hr) expression of cleaved caspase‐3, cleaved PARP, cleaved caspase‐9, BAX, cleaved caspase‐12, and BiP/GRP78, while increased the expression National Natural Science Foundation of Bcl‐2. (m) p47phox lentiviral RNAi vector transfection significantly decreased AOPP‐induced expression of cleaved caspase‐3 and cleaved PARP. (j–l) JNK inhibitor SP600125 (10 μm), p38 inhibitor SB203580 (10 μm), and ERK inhibitor U0126 (10 μm) significantly decreased AOPP‐induced (200 μg/ml, 48 hr) expression of cleaved caspase‐9, BAX, cleaved caspase‐12, BiP/GRP78, cleaved caspase‐3, and cleaved PARP. (n) Intracellular calcium level was determined by Fluo‐3/AM. AOPP (200 μg/ml) treatment induced Ca2+ overload in a time‐dependent manner, while this effect could be blocked by IP3R inhibitor Xestospongin C (5 μm) and NADPH oxidase inhibitor apocynin (100 μm). (o) Pretreated with caspase inhibitor Z‐VAD‐FMK (20 μm) and IP3R inhibitor Xestospongin C (5 μm) significantly decreased AOPP‐induced (200 μg/ml, 48 hr) cleaved PARP expression. Cells in the inhibitor group were pretreated with apocynin, DPI, SOD, SP600125, SB203580, U0126, Xestospongin C, and Z‐VAD‐FMK, respectively, for 40 min before AOPP administration, and all of them were present during AOPP incubation. Data were presented as mean ± SD. *p < .05 vs. control. #p < .05 vs. AOPP group
