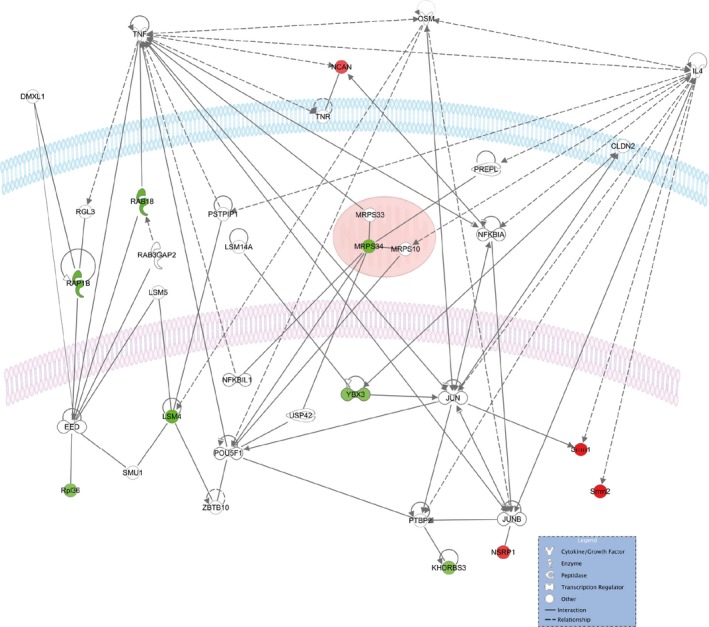
Figure 6.

Network visualization using Ingenuity Pathway Analysis of the 11 SUMO1 candidate substrates altered with age. Identified proteins with increased abundance are in red, and identified proteins with decreased abundance are in green. Cellular membrane is blue, nuclear membrane is in light purple, mitochondria are in red
