
Figure 4.
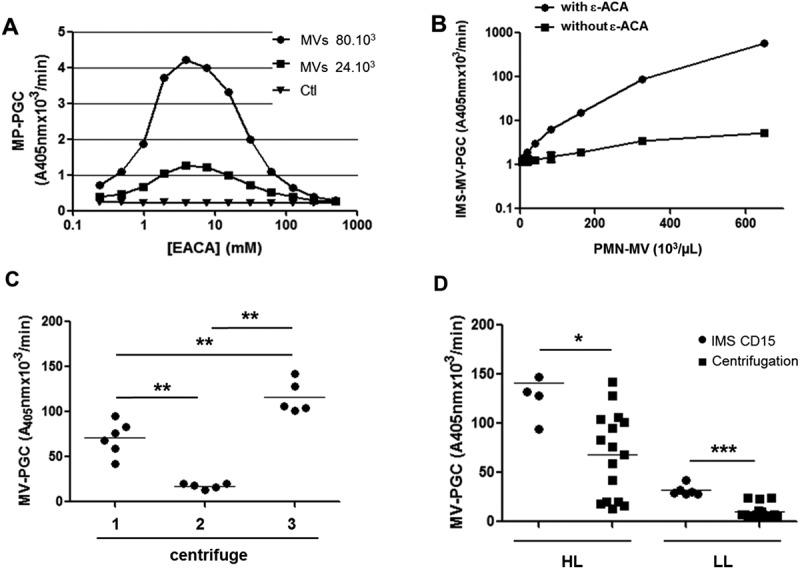
Sensitivity of the IMS-based MV-PGC assay.
A. A range of ε-ACA concentrations (0.25–500 mM) was evaluated in the plasmin chromogenic test in the presence of PMN-MVS (80 × 103 and 24 × 103). Ctl: negative control was represented by phosphate buffered saline (PBS), 0.1% bovine serum albumin and 0.1% NaN3 buffer (PBS/BA). B. Representative dose–response kinetics of plasmin generation generated by a range of normal plasma containing PMN-MVs (650.103/µL) with or without ε-ACA; n = 3. C. Comparison of MV-PGC of the same PFP centrifuged at 24,000 × g, 90 min, at room temperature on three different centrifuges with different rotors (F15-6 × 100y; FA45-24-11; JA-30.50). n = 6. D. Comparison of two methods for isolating MV with plasmin generation capacity, CD15-IMS versus centrifugation to measure MV-PGC on two plasmas with different levels of plasmin (HL: high level; LL: low level). n = 6