
Figure 7.
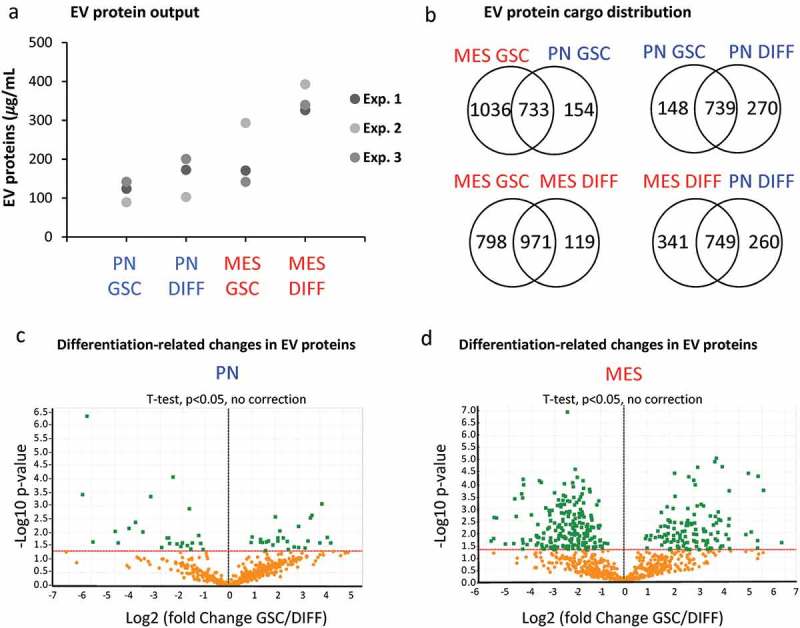
The impact of GSC subtype and differentiation status on the EV proteome. (a) Protein quantification in EV isolates from comparable GSC and DIFF cultures of PN and MES glioma cell lines. MES derived EV preparations contain higher total protein content than that of PN EVs. (b) Venn diagram of common and unique EV proteins identified by mass spectrometry in preparations of conditioned media from the indicated cell lines. (c-d) Differential expression of proteins expressed in GSC versus DIFF cells within PN and MES cell subtypes, respectively. MES glioma cells contain a greater number of proteins relative to PN cells. Coordinates: x axis = log2(fold-change) (GSC/DIFF), y axis = −log10(P value). The horizontal line indicates P value = 0.05. Data represent results of three independent experiments pooled together.