Figure 2.

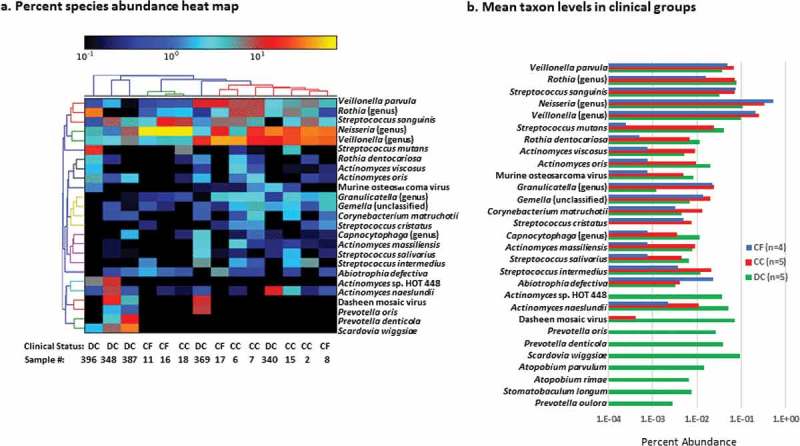
a. Per cent species abundance heat map. b. Mean taxon levels in clinical groups based on 25 abundant species (Figure 2a) with the four next most abundant species detected only in dentin compared by clinical group.

a. Per cent species abundance heat map. b. Mean taxon levels in clinical groups based on 25 abundant species (Figure 2a) with the four next most abundant species detected only in dentin compared by clinical group.