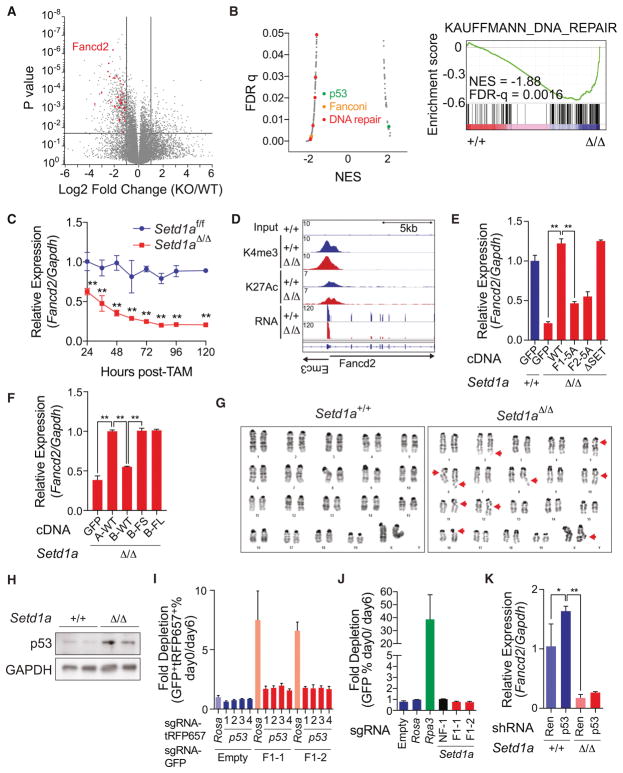
Figure 4. SETD1A FLOS domain regulates DNA damage response.
A. A volcano plot is used to depict RNA-seq data. Three independent samples on Setd1a+/+ and Setd1aΔ/Δ leukemia cells were analyzed. Significantly downregulated DNA repair genes classified by GO analysis (see also Figure S4A) are shown as red dots.
B. Gene set enrichment analysis was performed on RNA-seq data from MLL-AF9 leukemia cells. The scatter plot shows normalized enrichment score (NES) and false discovery rate (FDR) q-values comparing MSigDB curated gene set enrichment (left). Gene sets upregulated or downregulated in Setd1aΔ/Δ leukemia cells have positive or negative NES values, respectively. Representative enrichment plot from a DNA repair gene set is shown (right).
C. qRT-PCR was performed to analyze Fancd2 expression in Setd1afl/fl;CreER MLL-AF9 leukemia cells from 24 to 120 hours post-tamoxifen. This experiment was repeated 3 times with 3 biological replicates in each experiment.
D. Histograms depict H3K4me3, H3K27Ac and mRNA peaks on the Fancd2 locus in Setd1a knockout leukemia cells.
E. MLL-AF9 leukemia cells were transfected with SETD1A mutant cDNA and qRT-PCR analysis of Fancd2 was performed at 4 days post-tamoxifen. Representative data from one out of 2 independent experiments with 3 biological replicates are shown.
F. MLL-AF9 leukemia cells were transfected with SETD1A/B mutant cDNA and qRT-PCR analysis of Fancd2 was performed at 4 days post-tamoxifen. Representative data from one out of 2 independent experiments with 3 biological replicates are shown.
G. Images are shown of representative karyotypes in control and Setd1a-deficient leukemia cells. Red arrows indicate breaks/gaps on the chromosome. See Table 1.
H. MLL-AF9 leukemia cells were treated with tamoxifen and p53 protein expression was analyzed by western blot analysis at 4 days post-tamoxifen.
I. p53 sgRNAs with a tRFP657 reporter and Setd1a FLOS1 sgRNAs with a GFP reporter were sequentially transfected into iCas9-expressing MLL-AF9 leukemia cells. Representative data from one out of 2 independent experiments with 3 biological replicates are shown.
J. Setd1a FLOS1 sgRNAs with a GFP reporter were transduced into p53−/− derived iCas9-expressing MLL-AF9 leukemia cells. Representative data from one out of 2 independent experiments with 3 biological replicates are shown.
K. MLL-AF9 leukemia cells were transfected with p53 shRNA and treated with tamoxifen for 24 hours. Relative expression level of Fancd2 was quantified by qRT-PCR at 4 days post-tamoxifen. Representative data from one out of 2 independent experiments with 3 biological replicates are shown.

