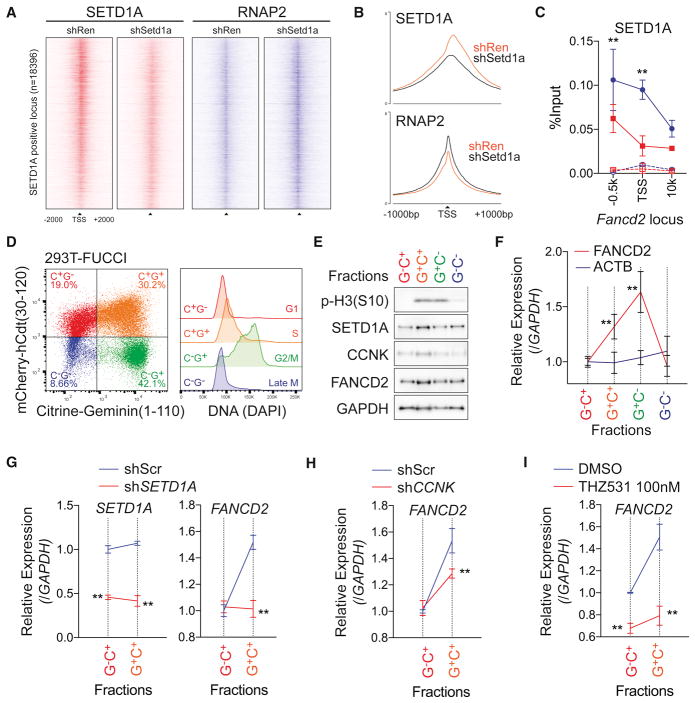
Figure 7. SETD1A-Cyclin K regulates FANCD2 transcription in G1/S-phase.
A. Density of ChIP-seq reads for SETD1A (red) and RNAP2 (blue) of SETD1A positive TSS (n=18396) from Ren shRNA or Setd1a shRNA–expressing NIH3T3 cells are shown. Regions are ranked according to log2 fold change of SETD1A signal intensity between Ren and Setd1a shRNA.
B. Average ChIP-seq signal of SETD1A (upper) and RNAP2 (lower) of SETD1A positive TSS from Ren shRNA or Setd1a shRNA-expressing NIH3T3 cells are shown.
C. ChIP-qPCR was performed for SETD1A on the Fancd2 locus in Ren shRNA (blue) or Setd1a shRNA (red) –expressing NIH3T3 cells at 4 days post-dox. Rabbit IgG was used as negative control in ChIP (dot lines). Representative data from 3 independent experiments with 3 biological replicates are shown.
D. Cell cycle stage was visualized by flow cytometry in a FUCCI positive 293T single cell clone (left panel). DNA contents in each fraction are shown in the right panel.
E. 293T-FUCCI cells were fractionated by cell sorting. Western blot analysis was performed using the indicated antibodies. Representative data from 3 independent experiments are shown.
F. FANCD2 transcriptional level during the cell cycle was monitored by qRT-PCR. This experiment was repeated 3 times with 3 biological replicates in each experiment.
G. Scramble shRNA (Scr, blue) and SETD1A shRNA (red) –expressing 293T-FUCCI cells were analyzed at 4 days post-transfection. Expressions of SETD1A (left) and FANCD2 (right) are shown. See also Figure S7E.
H. FANCD2 transcription in Scr shRNA (blue) and CCNK shRNA (red) –expressing 293T-FUCCI cells were analyzed at 4 days post-transfection. See also Figure S7F.
I. FANCD2 transcription in DMSO (blue) and 100 nM THZ531 (red) –treated 293T-FUCCI cells were analyzed at 3 days post-treatment. Representative data from one out of 2 independent experiments with 3 biological replicates are shown.

