
Figure 3.
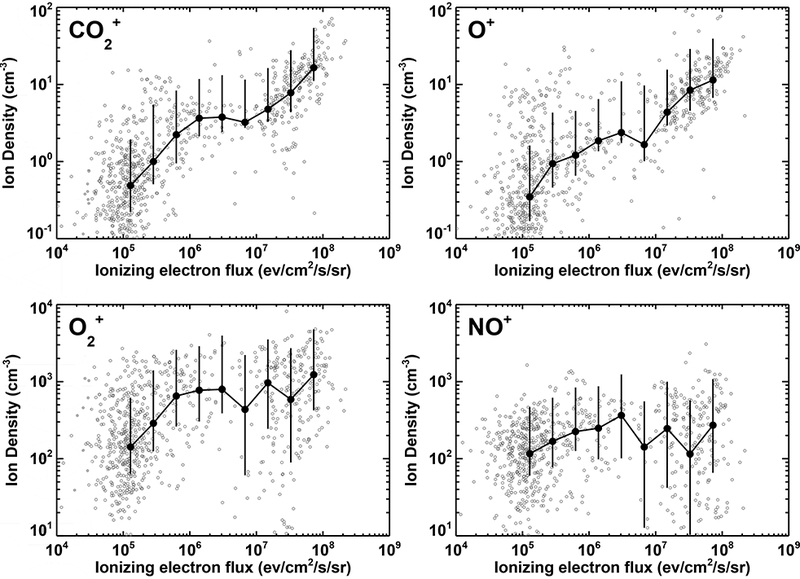
Nightside ion densities at 160 km as a function of the ionizing electron flux. In each panel the gray circles show the NGIMS measurements, the black line shows a running median, and the error bars show the 25% and 75% quartiles. The scales of the ion density axes for and O+ are different than those for and NO+.