
Figure 4.
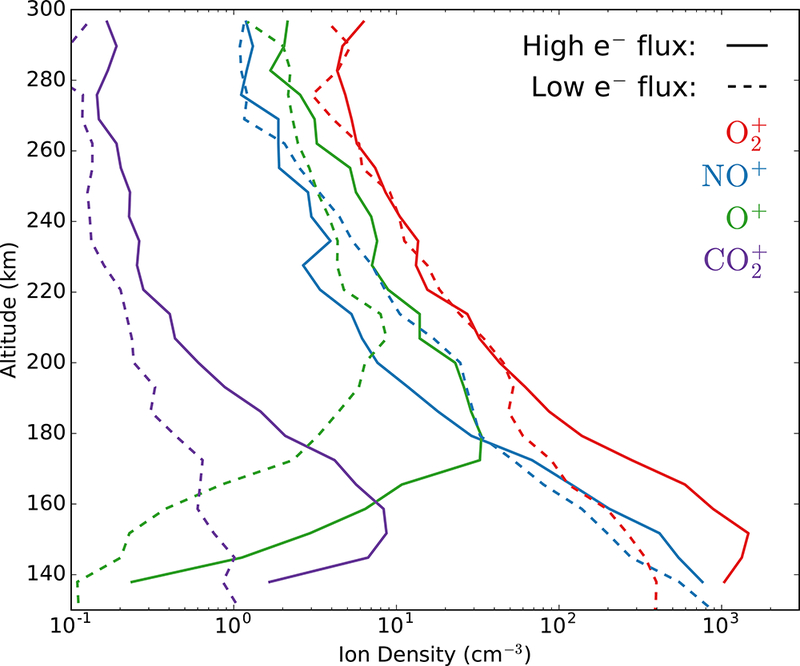
Median altitude profiles of nightside , NO+, O+, and during times of low and high ionizing electron flux. The solid lines show median profiles for high ionizing electron flux (<106 eV/cm2/s/sr) and the dashed lines show median profiles for low ionizing electron flux (<106 eV/cm2/s/sr). The most significant effects of electron impact ionization are seen below 200 km, where distinct peaks in the , O+, and profiles are present when the electron flux is high, but absent when the electron flux is low.