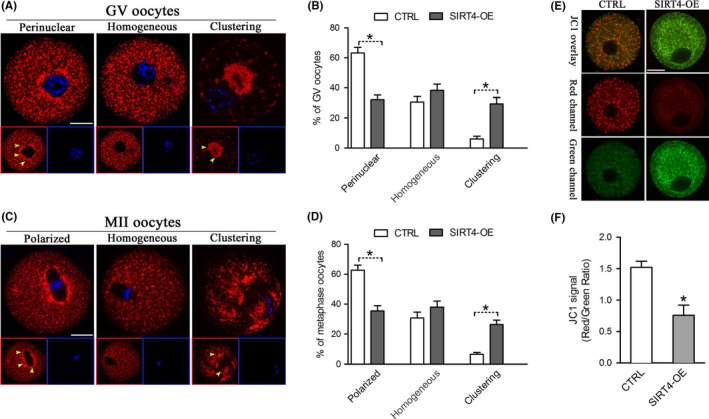
Figure 3.

SIRT4 overexpression disrupts mitochondrial redistribution and membrane potential in oocyte. Control and SIRT4‐OE oocytes were labeled with MitoTracker Red to visualize mitochondrial localization and counterstained with Hoechst 33342 to show meiotic stages. Mitochondrial distribution patterns were evaluated using confocal microscopy. (A) Representative images of mitochondrial distribution patterns in GV oocytes: perinuclear distribution, homogeneous distribution, and clustering distribution. (B) Quantification of control and SIRT4‐OE oocytes at GV stage with each mitochondrial distribution pattern. (C) Representative images of mitochondrial distribution patterns in MII oocytes: polarized distribution, homogeneous distribution, and clustering distribution. (D) Quantification of control and SIRT4‐OE oocytes at MII stage with each mitochondrial distribution pattern. (E) Mitochondrial membrane potential in control and SIRT4‐OE oocytes measured by JC‐1 fluorescence. The green fluorescence shows inactive mitochondria and the red fluorescence shows active mitochondria in oocytes. (F) Histogram showing the JC‐1 red/green fluorescence ratio. Error bars indicate ± SD. *p < 0.05 vs. control. Scale bars: 25 μm
